


rev02
MRK950-MRK960 Manager
Pag.
11
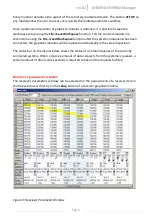
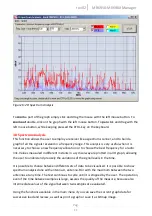
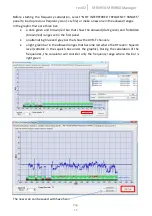
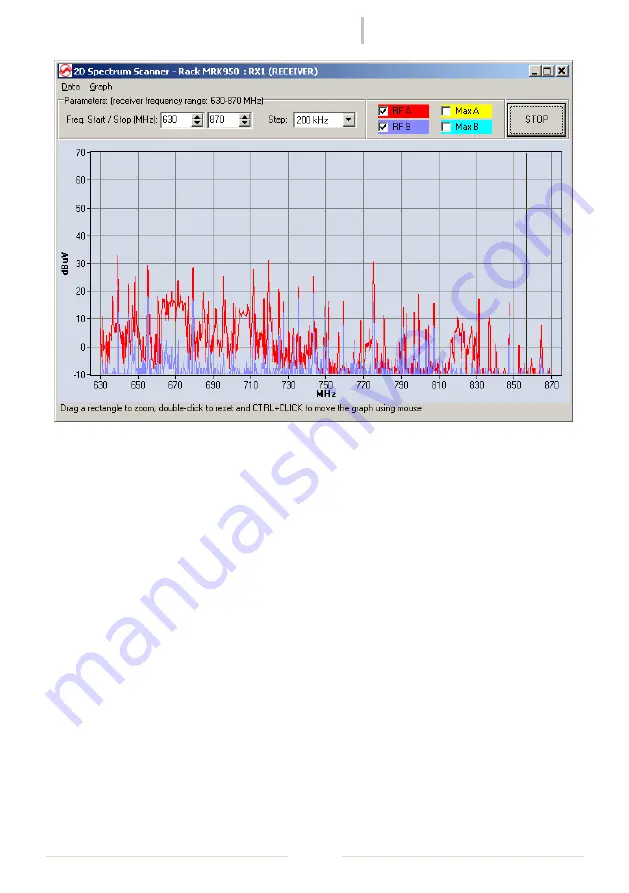
Figure 6: 2D Spectrum Analysis
To
zoom
a part of the graph simply click and drag the mouse with the left mouse button. To
zoom out
double-click on the graph with the left mouse button. To
pan
click and drag with the
left mouse button, while keeping pressed the CTRL-key on the keyboard.
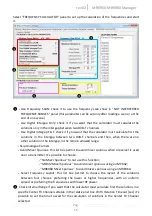
3D Spectrum Analysis
This function allows the user to employ a receiver like a spectrum scanner, and to build a
graph of all the signals received in a frequency range. This analysis is very useful when it is
necessary to choose a new frequency allocation or to choose the best frequency for a radio
link. Values measured in different instants in a cyclical way are plotted in a 3D graph, allowing
the user to understand precisely the variations of the signal levels in the time.
It is possible to choose between different sets of data to be visualized. It is possible to show
spectrum analysis done with antenna-A, antenna-B or with the maximum between the two
antennas at any time. The test continues to cycle until it is stopped by the user. The operation,
even if the time between samples is large, assures the quality of the measure, because also
intermediate values of the signal between two samples are evaluated.
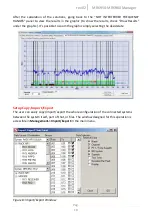
Using the functions available in the main menu it you can save the current graph data for
successive load and review, as well as print a graph or save it as bitmap image.