


rev02
MRK950-MRK960 Manager
Pag.
10
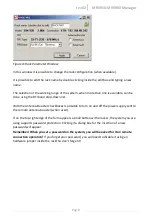
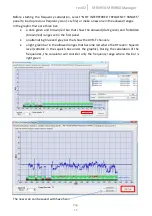
choose the receiver that should be used for the operation and tune it to the
interested channel
select the receiver on the tree-view and start the Walk-Test analysis from the popup
menu or from
Tool->Walk Test
on the main menu.
Select
Duration
and
Interval
parameters and press
RUN
With this functionality it is also possible to analyze, with the transmitter turned-off, the
possible spot-presence of foreign signals on the selected channel.
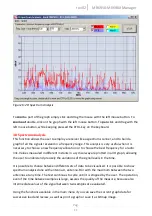
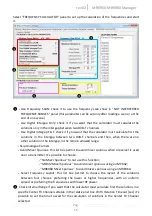
To
zoom
a part of the graph simply click and drag the mouse with the left mouse button. To
zoom out
double-click on the graph with the left mouse button. To
pan
click and drag with the
left mouse button, while keeping pressed the CTRL-key on the keyboard.
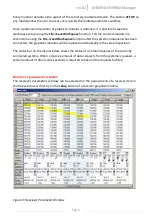
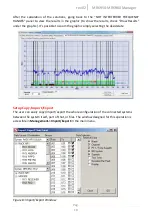
2D Spectrum Analysis
This function allows the user to employ a receiver like a spectrum scanner, and to build a
graph of all the signals received in a frequency range. This analysis is very useful when it is
necessary to choose a new frequency allocation or to choose the best frequency for a radio
link.
Enable RF-A and RF-B checkboxes to show Antenna-A and Antenna-B analysis, while Max-A
and Max-B checkboxes enables data traces relative to maximum signal level relative to a single
frequency. The test continues to cycle until it is stopped by the user. The operation, even if the
time between samples is large, assures the quality of the measure, because also intermediate
values of the signal between two samples are evaluated.
Using the functions available in the main menu it you can save the current graph data for
successive load and review, as well as print a graph or save it as bitmap image.
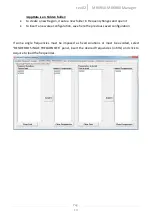
To perform a spectrum analysis the user must do the following tasks:
select the receiver to be used for the operation on the tree-view and start the 2D
Spectrum Scanner analysis from the popup menu or from
Tool->2D Spectrum
Analyzer
on the main menu.
Select the desired
Frequency range,
the
Step
(100/200/500 KHz , 1/2MHz) and the
Data Source
for the measure and press
RUN