


rev02
MRK950-MRK960 Manager
Pag. 9
Advanced Operation
This software allows the user to employ an hardware device for special purposes, like signal
fading analysis, spectrum analysis and special graphical management of the broadcast system.
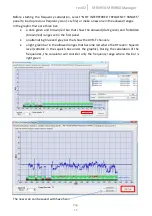
Walk Test
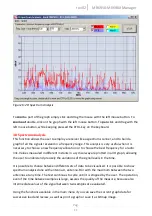
The walk test graph shows the envelope of the RF signal received in any time from the
receiver, detected on the same radio signal frequency and sampled with a fixed time interval.
The user can enable this function with a duration long enough to cover by walking with the
transmitter turned-on the whole area that could be interested by the broadcast event, and to
test the effective coverage of the system, the presence of not-enough covered locations, and
the effectiveness of the diversity system. Enable RF-A and RF-B checkboxes to show Antenna-A
and Antenna-B analysis.
In normal condition, after the duration time, the test stops automatically. If Max-A or Max-B
checkboxes are enabled, the test instead continues to cycle, showing always the maximum
value that the signal reached at any time, allowing a very long lasting analysis. The operation,
even when the time interval is large, assures the quality of the measure, because also
intermediate values of the signal between two samples are evaluated.
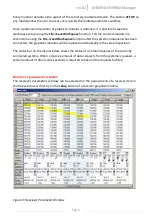
Figure 5: Walk Test Graph Example
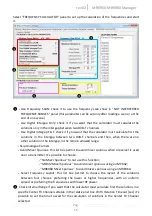
Using the functions available in the main menu it you can save the current graph data for
successive load and review, as well as print a graph or save it as bitmap image.
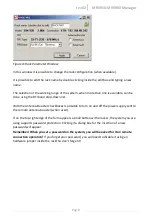
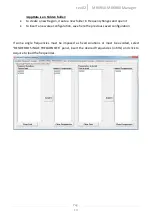
To perform a walk test analysis the user must do the following tasks: