14
■
Static charge voltage Measurement
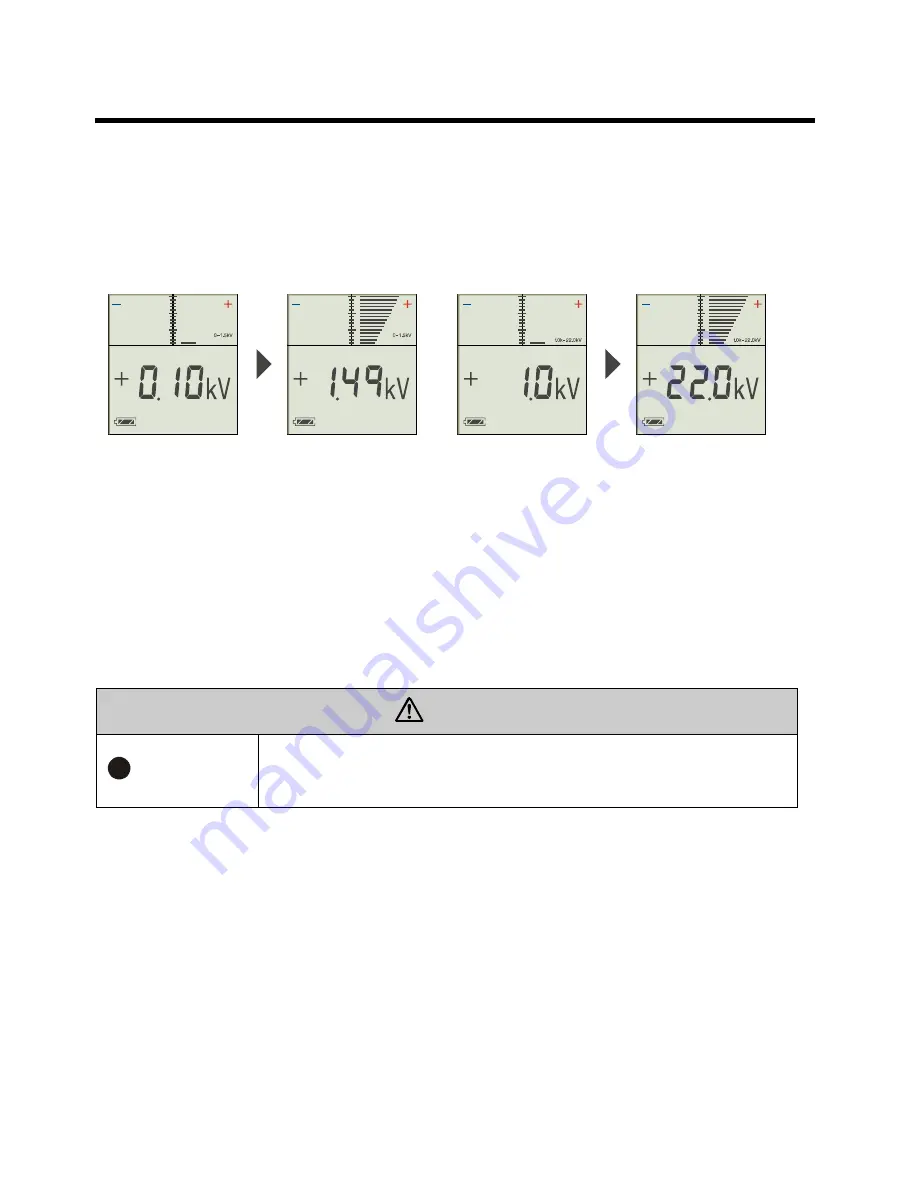
Display
The bar graph and digital value displayed on the LCD display indicate the size of the static
charge of the charged object being measured. This display has a LO range and HI range in
which the position of the decimal point changes as shown below. This range changes
automatically according to the size of the target object’s charge.
LO range display
HI range display
* The polarity of measured static charge is indicated by sign of [+] or [-] displayed to the left of the
numerical value. In addition, the color of the bar graph indicates the polarity of the static charge,
red being positive and blue negative.
Right: Positive charge Left: Negative charge
* Each bar of the bar graph corresponds to 0.1 kV (100 V) approximately for low range and 1.5 kV
(1500 V) approximately for high range.
* Eye-02 is calibrated for the voltage range 0 to ± 20 kV, using a 150 mm x 150 mm charged flat
metal plate placed at a distance of 25 mm. For any other distance, accuracy of measurement is
not guaranteed. If a charged object is large enough and the measuring distance is correct, the
display gives a direct reading of the Static charge voltage.
Display
REMEMBER
The accuracy is guaranteed only at a measurement distance of 25 mm.
When measuring at a different distance, prepare calibration data and
calibrate the measurement value and true value.


