Data Analysis
– Viewing Data And Graphs
4200-002
120
Revision 6
10 Data Analysis
– Viewing Data And Graphs
The following sections describe how
to view and customize the graph for
window display, printing, and
exporting data for report generation.
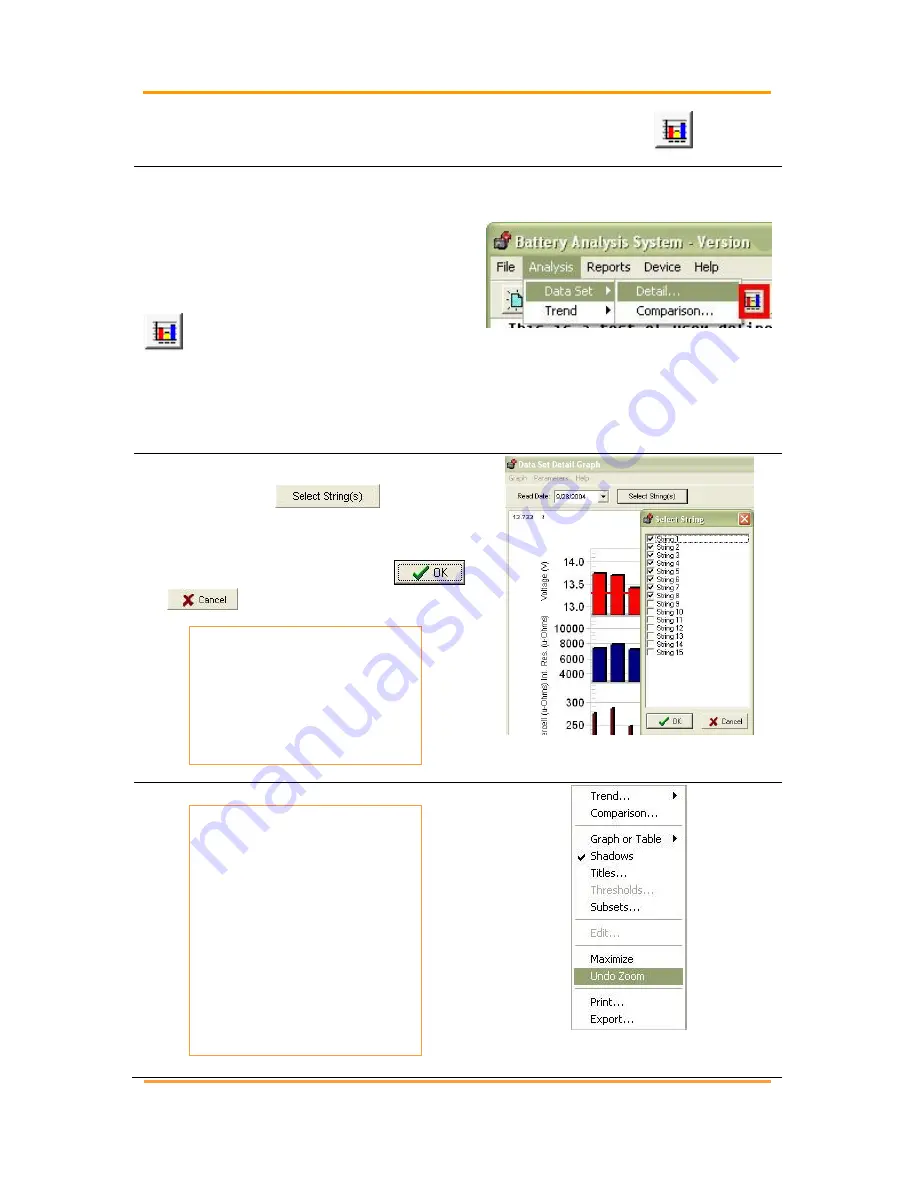
To view battery data set graphs, click
on the toolbar or go to Main
Menu, select Analysis|Data Set and
either Detail or Comparison or
Analysis|Trend and Cells or Cell
Averages.
Figure 243. Main Menu >
Analysis|Data Set|Detail
When using multiple strings, a Select
Strings button;
appears
at the top of the window. To select
strings, click the button to open a
Select String Window. Click
or
as needed.
NOTE:
Descriptions in this
chapter apply to the
Data Set Detail,
Comparison and Trend
graphs.
Figure 244. Select Strings
NAVIGATION NOTES:
To enlarge an area of
interest on a graph,
drag a rectangle across
it. Be careful not to click
on a bar within the
graph while enlarging
an area of the graph. To
return to normal size,
right click the bar graph
and click Undo Zoom.
Figure 245. Undo Zoom


