ColonyDoc-It Imaging Station
40
Measure Length:
Allows users to draw a line and measure the distance between any two points on the
image, units depend on spatial calibration
Measure Angle:
Allows users to draw an angle and measure the degree value contained in that angle
Measure Area:
Allows users to draw an area and measure the area contained within that area
New ROI:
Removes the active Region of Interest and prepares for a new one of the current type
Rectangular ROI
: Changes the current mouse tool to select the Rectangular Region of Interest and brings
up one if already present on the current image
Elliptical ROI
: Changes the current mouse tool to select the Elliptical Region of Interest and brings up one
if already present on the current image
Polygonal ROI:
Changes the current mouse tool to select the Polygonal Region of Interest and brings up
one if already present on the current image
Freeform ROI:
Changes the current mouse tool to select the Freeform Region of Interest and brings up
one if already present on the current image
Magic Wand ROI:
Lets users select a consistently colored area (for example, a red flower) without having
to trace its outline
Reporting Functions
The results of the colony count can be displayed in the results window. To show the results:
Click the
Show Results Window
to bring up the colony count results.
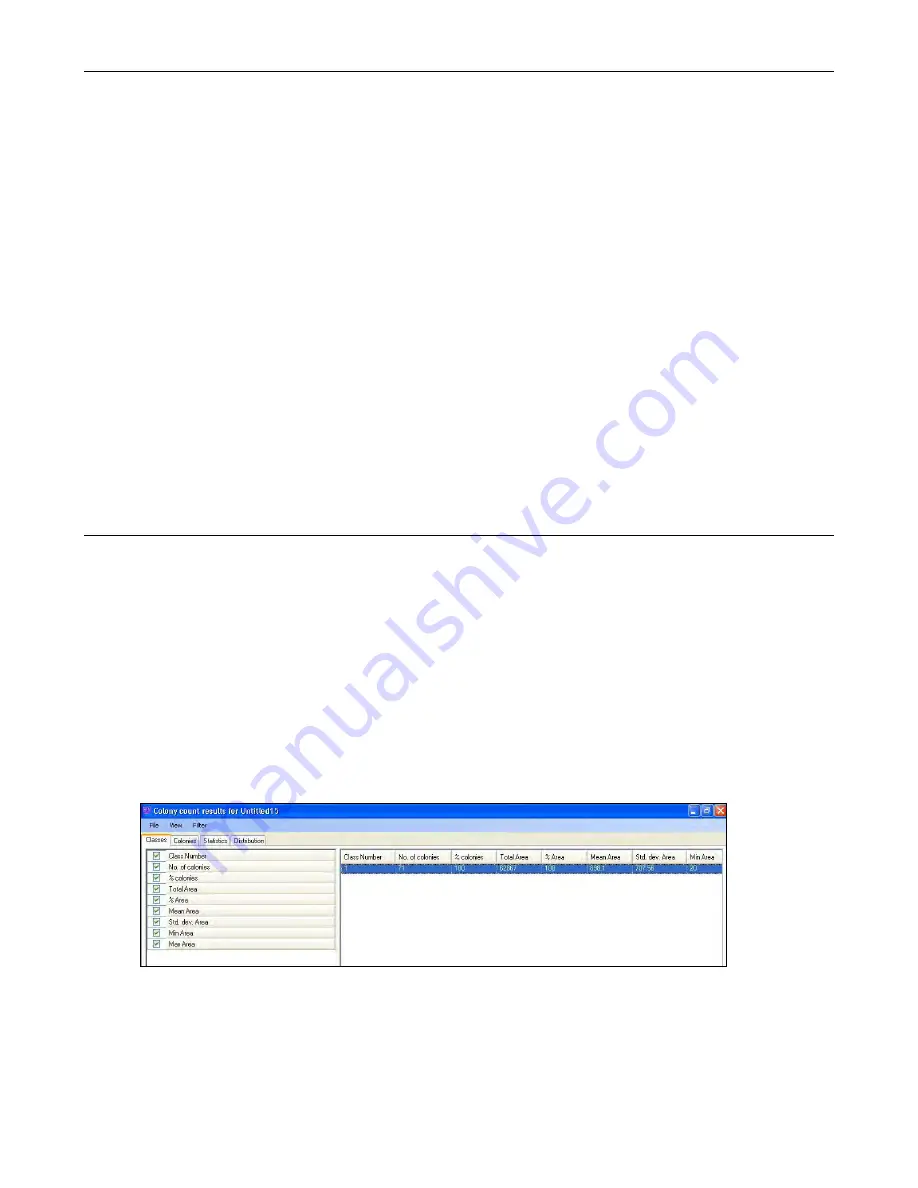
The colony count results for the Petri dish are displayed with tabs on the upper left hand side
of the screen.
The tabs are Classes, Colonies, Statistics, and Distribution.
Classes
In the
Classes
tab, information is displayed regarding critical parameters of each class recognized in the Petri dish.
The Classes reported category and associated values are listed below.
NOTE:
All dimensional information is reported in pixels unless the plate has been calibrated.
Number of classes in the sample
Number of colonies in that class
Percent of colonies of that colony classification in the sample


