UGO BASILE - I
TALY
Page 19
Series 58000 Instruction Manual (Rev.1)
When the pressure has descended to 50 mm Hg, the chart motion stops whilst the piston contin-
ues its run until its travel end. At this point the cylinder comes in connection with the room air via
a side port.
Beside the chart, even the data collection and processing stops when the pressure has de-
scended to 50 mm Hg.
The data collection phase is over. The operator, in lieu of figures only, faces the patterns of pulse
signal too, which is, by definition, the key
to read
both systolic and diastolic pressure.
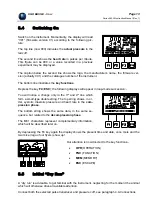
If we have selected the UP/DOWN mode (systolic pressure,
assessed in compression & decompression run) the following
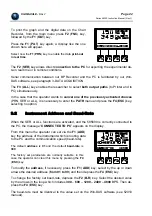
graph will appear:
The solid black zones are
tight packages of spikes
. Each
spike represents a pulse beat generated by the caudal artery
(arteria caudalis) and transmitted via the surrounding tissues
to the pulse transducer.
In the top line we read
SYST.UP
and the pressure value (141
mm Hg in this example) at which the pulse amplitudes is re-
duced to nil.
The vertical line represents the division between the compression and decompression phases.
The cursor, the small mark at the centre of the graph, can be shifted back and forth via
F1
and
F2
. When the cursor moves, the corresponding pressure value (141 in this example) changes ac-
cordingly.
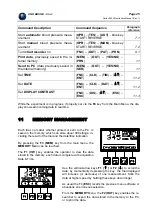
By shifting the cursor, the trained operator can select in the graph the point at which the pulse
disappears (
systolic
) and the point at which there is an unmistakable transition from steady to
decreasing amplitude (
diastolic
)
even in unfavourable trials
.
It is plain to see, when accidental
noise
, in practice brought about by animal struggling, spoils the
clarity of the graph outline, i.e., spurious “spikes” appear amid the smooth pressure outline.
The key
F3
(
Z
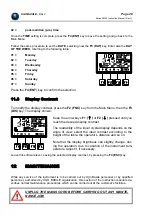
) helps to increase the size of the graph acting as a zoom. By depressing
F3
again
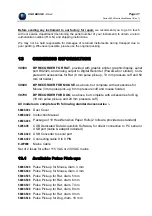
the graph returns to the original size. At this point, depress the key
F4
(
OK
)
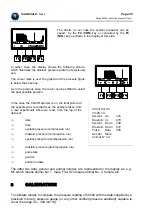
and the following dis-
play will appear:


