


UGO BASILE - I
TALY
Page 18
Series 58000 Instruction Manual (Rev.1)
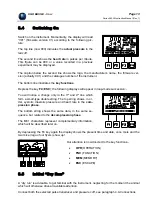
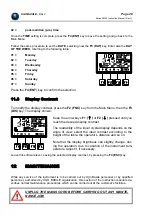
Act
on the arrows keys
F1
(
↑
)
or
F2
(
↓
)
to ob-
tain a signal within the
display limits.
To obtain an optimal
reading, the signal
should span on all the
available portion of the
display.
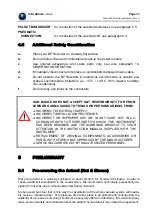
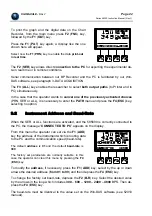
The
F3
key, (
x10
) or (
:10
), acts as a zoom: respectively, it amplifies the display of a weak signal
(see example on the left) or it makes a strong signal smaller (see example on the right).
When the signal is adjusted, depress the blue key
START/REVERSE
, see paragraph below.
7.3
Starting the Pressure
Measurement
The geared motor starts at a somewhat high angular
speed. But as soon the cylinder pressure reaches 10
mm Hg, the traverse speed of the piston (see para-
graph 6.1.2-Speed Selection) is automatically adjusted
to the selected speed (SPEED 1 or SPEED 2).
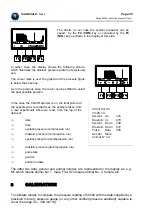
You will see from the display that the top line indicates the
cuff increasing pressure, up to dated at one second inter-
vals.
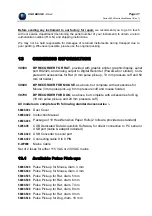
In the case the chart recorder is on and correctly set (compression phase), once the pressure
reaches 50 mm Hg, the chart motion starts and the graph will appear, see the following sample of
recording.
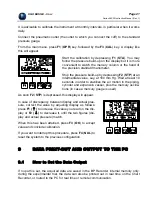
As soon the cuff pressure exceeds the systolic pressure, the amplitude of the pulse signal is re-
duced to nil or, better to say, in this sample which comes from a real test, to the level of
noise
(approximately 118 above). Incidentally, note that the bar we mentioned when speaking about the
signal amplitude has concomitantly shrunk to a blip.
After about two seconds, the motion automatically reverses and the decompression phase be-
gins. See the sample of graph below; note beginning of recovery of signal at approximately 114: