


32 | Touchscreen Controller Display Functioning
Medical Devices -Touch Controller
-
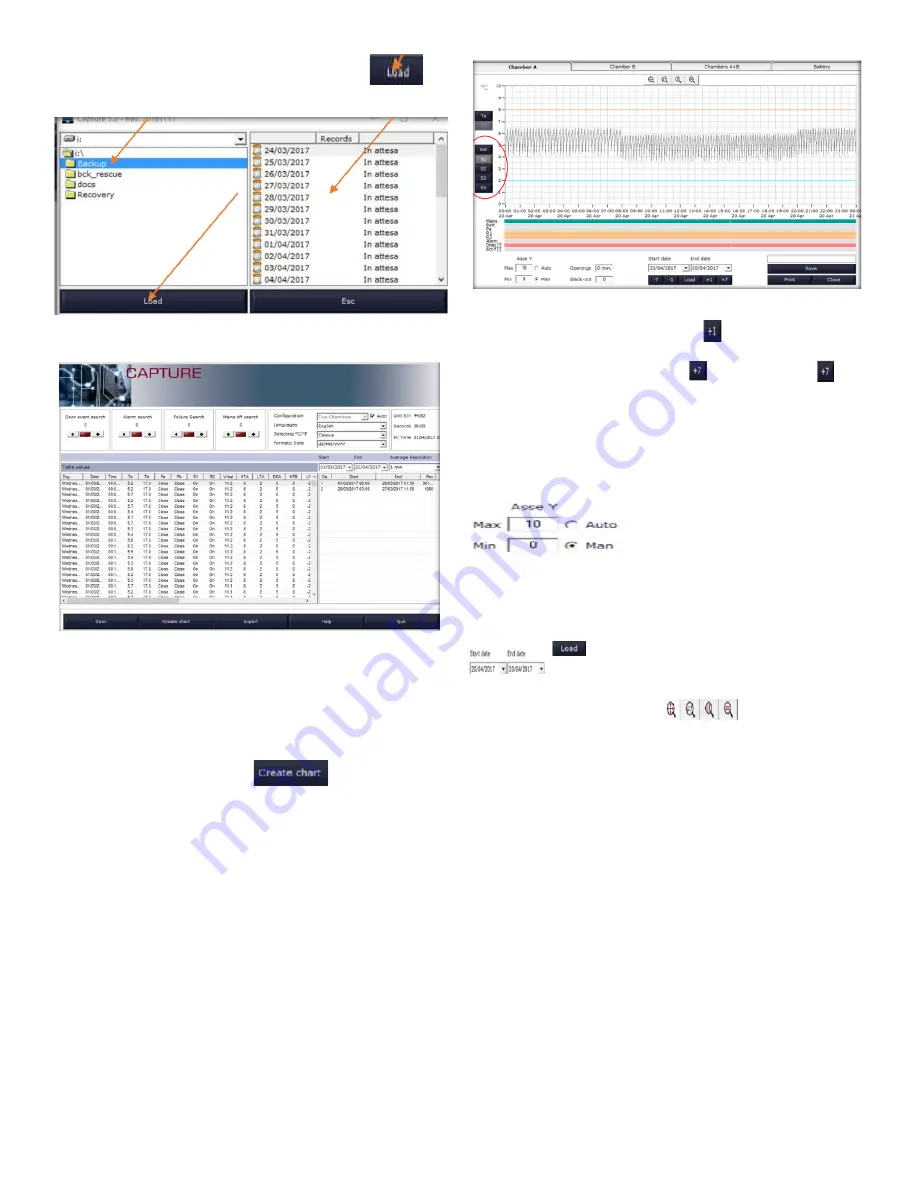
Double click the Backup folder and click
.
Wait for data loading.
How to Create a Temperature
Graph
When data has been downloaded, it is possible to
create charts by clicking on
.
Then, select the desired chamber
(Chamber A – Chamber B – Chamber A+B – Battery)
The following relevant data is visualized in each chart:
Serial Number:
Serial number of the device
Start / end date of the graph
Print the date of printing
The chart is daily and by clicking
it is possible to
visualize the temperature graph of the next day. You can
build a weekly chart by clicking . Clicking again the
next week temperature chart will be visualized.
The scale on the axis of the graph of the temperatures is
automatic and it is based on the values displayed on the
chart but you can change it using the appropriate menu
in the lower left by selecting the "Man".
Click the buttons at the left of the graph to enable or
disable the visualization of the desired chamber
(Ta-Tb-Set- 1-S2-S3-Rh).
The button
allows setting a start/end date
to create a customized chart of the required
period.
The available “Zoom” tools
and the “Auto
Scale” Y-axis function allows performing further analysis
on the recorded data.


