Chapter 3: Function Graphing
93
Defining Graphs
Defining Graphs
Defining Graphs
Defining Graphs
TI-84 Plus—Graphing Mode Similarities
TI-84 Plus—Graphing Mode Similarities
TI-84 Plus—Graphing Mode Similarities
TI-84 Plus—Graphing Mode Similarities
Chapter 3 specifically describes function graphing, but the steps shown here are similar
for each TI-84 Plus graphing mode. Chapters 4, 5, and 6 describe aspects that are
unique to parametric graphing, polar graphing, and sequence graphing.
2.
Press
q
6
to select
6:ZStandard
. This is a
quick way to reset the window variables to the
standard values. It also graphs the functions; you
do not need to press
s
.
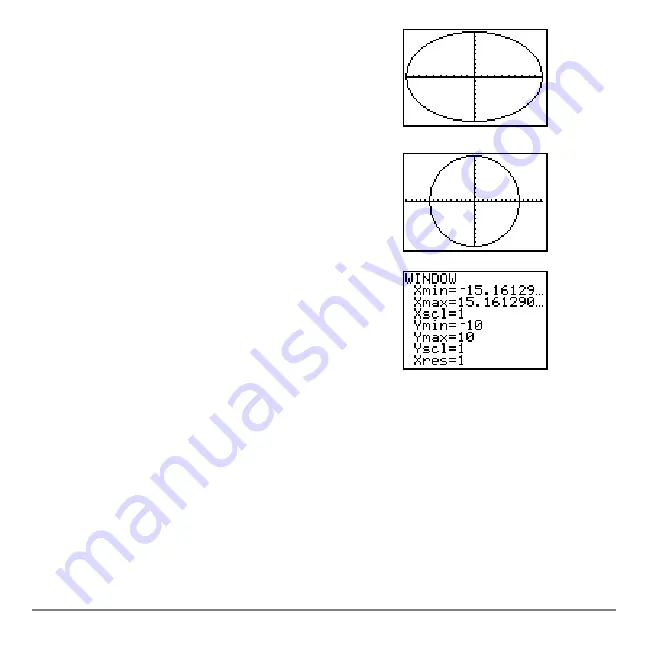
Notice that the functions appear as an ellipse in
the standard viewing window.
3.
To adjust the display so that each pixel represents
an equal width and height, press
q
5
to select
5:ZSquare
. The functions are replotted and now
appear as a circle on the display.
4.
To see the
ZSquare
window variables, press
p
and notice the new values for
Xmin
,
Xmax
,
Ymin
, and
Ymax
.
Summary of Contents for -84 Plus
Page 1: ...TI 84 Plus TI 84 Plus Silver Edition Guidebook...
Page 213: ...Chapter 8 Draw Instructions 210...
Page 248: ...Chapter 10 Matrices 245 row value matrix rowA rowB...
Page 332: ...Chapter 12 Statistics 329...
Page 413: ...Chapter 14 Applications 410...
Page 427: ...Chapter 15 CATALOG Strings Hyperbolic Functions 424 sinh 1 value cosh 1 value sinh 1 value...
Page 496: ...Chapter 17 Activities 493 If C A and D B Stop Goto Z Quit if guesses are correct...
Page 672: ...Appendix C Service and Warranty Information 669...


