


12
SVANTEK 977W User Manual
change the relationship between the Y-axis and X-axis of all plots presented on the
screen.
[
▲,▼
]
The
▲ or ▼
push-buttons pressed together with
<Alt>
enable the user specifically to:
change the mode of result presentation;
programme the Real-Time Clock (
RTC
) and
Timer
.
[Info]
The
<Info>
push-button (simultaneous pressing the
◄
and ► push-buttons) opens the window with the help
information in the measurement display modes. Press
<ESC>
or <
ENTER
> to exit the Info screen.
<Markers>
The <
Markers>
push-button (
<Alt>
pressed together with
<Shift>
) enables the user to
mark special events, which occurred during the performed measurements (i.e. the
airplane flight, the dog barking, the train’s drive etc.). To activate the markers, the logger
should be switched on (
path: <Menu> / Measurement / Logging / Logger Setup
) and one
or more logger results (
Peak
,
Max
,
Min
,
Leq
for sound measurements or
Peak
,
P
–P
,
Max
,
RMS
for Vibration measurements) in profiles have to be activated (
path: <Menu>
/ Measurement / Logging / Logger Results).
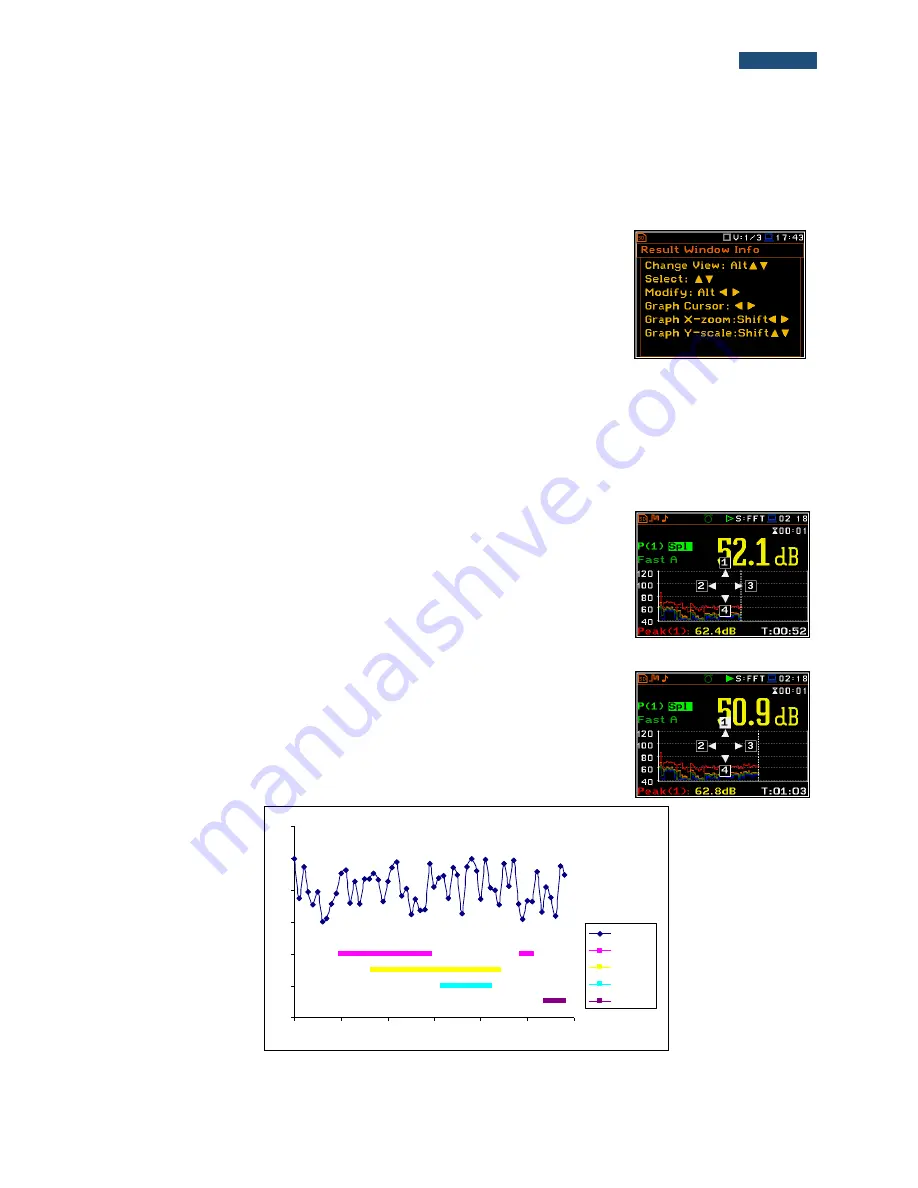
To enter the marker mode, the user must press
<Shift>
and
<Alt>
push-buttons
simultaneously during the measurement. Then four available markers appear on
the screen. To switch on marker number 1 the user must press
▲
push button
(number 2 -
◄, number 3 - ►
and number 4 -
▼
). Active marker number will be
highlighted. To switch off the marker the user should press the appropriate arrow-
button second time.
The markers disappear from the screen after pressing
<Shift>
and
<Alt>
, but
the status of markers doesn’t change. To continue working with the markers, the
user should press
<Shift>
and
<Alt>
again.
The current state of the markers is indicated in the logger file (cf. App. B for
details) and can be used to show them with the help of the dedicated presentation
software.
An example presentation of the markers on the time history plot is shown below
(to view a plot with markers the user should transfer data to the appropriate
software such as +).
<Shift>
/
<Alt>
▲
20
30
40
50
60
70
80
13:30:00 13:30:09 13:30:17 13:30:26 13:30:35 13:30:43 13:30:52
Leq
Marker 1
Marker 2
Marker 3
Marker 4


