


-49-
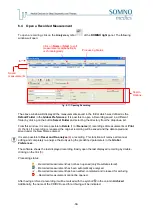
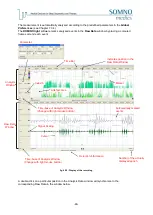
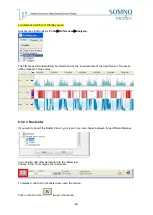
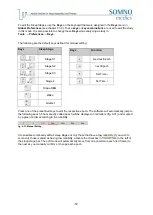
a) Automatic definition of TIB/Day areas:
Activate the Light Analysis (
Tools
→
Preferences
→
Analysis
).
The TIB areas will automatically be determined by the recorded data of the Light Sensor. The areas
will be marked in blue colour.
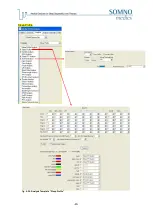
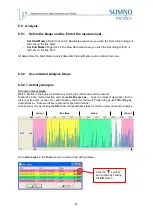
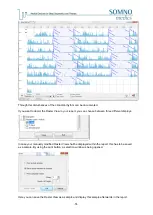
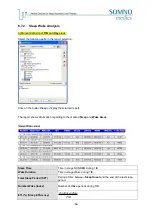
6.5.2.3 Rasterviw
If you want to depict the Raster View in your report, you can choose between three different displays.
You can also add other parameters to the rasterview.
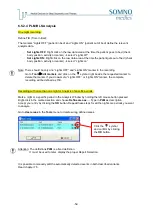
Choose in the Tools menue the rasterview.
To display a channel in the rasterview, open the menue.
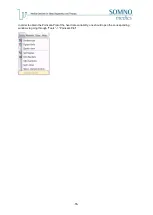
Click on the tool Icon
to open the menue.
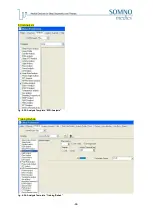
Summary of Contents for SOMNOwatch plus
Page 24: ...24 Body Temperature fig 6 8 Montage Temperature EDA fig 6 9 Montage EDA...
Page 25: ...25 Sleep Profile fig 6 10 Montage Sleep Profile ECG Analysis fig 6 11 Montage ECG...
Page 26: ...26 Training Rehab fig 6 12 Montage Training Rehab Flow Snore fig 6 13 Montage Flow Snore...
Page 42: ...42 Body Temperature fig 6 22 Analysis Template Temperature EDA fig 6 23 Analysis Template EDA...
Page 43: ...43 Sleep Profile fig 6 24 Analysis Template Sleep Profile...
Page 63: ...63 Choose the item Activity profil within the Select Report window...
Page 72: ...72 recording on both legs...
Page 162: ...162 10 9 Notes...


