


-110-
7.3.4.14
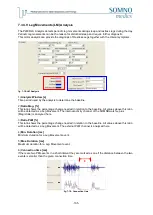
Temperature Analysis
The Body Temperature Analysis displays the temperature curve during the night or the complete day
and can provide indicators for disturbance of the circadian rhythm.
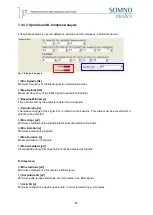
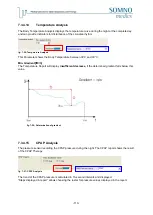
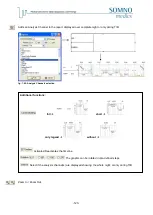
fig. 7-25: Temperature Analysis
This Parameter shows the Body Temperature between 34°C and 39°C.
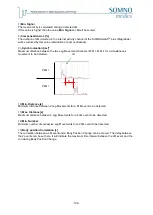
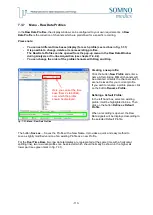
Min. Gradient [
C/h]
The Temperature Report will display
insufficient decrease,
if the determined gradient falls below this
value.
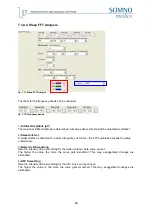
fig. 7-26: Determination of gradient
7.3.4.15
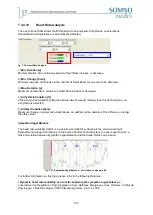
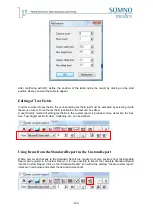
CPAP Analysis
The pressure sensor recording the CPAP pressure during the night. The CPAP report shows the result
of the CPAP Therapy.
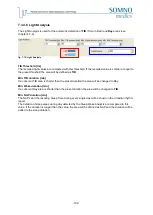
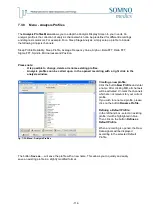
fig. 7-27: CPAP Analysis
The trend of the CPAP pressure is calculated in 15-second intervals and displayed.
“Steps displayed in report” allows choosing the raster for pressure values displayed in the report.
Summary of Contents for SOMNOwatch plus
Page 24: ...24 Body Temperature fig 6 8 Montage Temperature EDA fig 6 9 Montage EDA...
Page 25: ...25 Sleep Profile fig 6 10 Montage Sleep Profile ECG Analysis fig 6 11 Montage ECG...
Page 26: ...26 Training Rehab fig 6 12 Montage Training Rehab Flow Snore fig 6 13 Montage Flow Snore...
Page 42: ...42 Body Temperature fig 6 22 Analysis Template Temperature EDA fig 6 23 Analysis Template EDA...
Page 43: ...43 Sleep Profile fig 6 24 Analysis Template Sleep Profile...
Page 63: ...63 Choose the item Activity profil within the Select Report window...
Page 72: ...72 recording on both legs...
Page 162: ...162 10 9 Notes...


