Display views
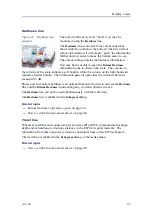
Biomass line
Figure 21
Biomass line,
example
The biomass may be monitored using the
Biomass
line.
The biomass line is an extra thick brightly coloured line
that is added to the echogram. The line will identify the
variations in biomass. To adjust the view, use the scale.
The changes made in the
Calculation Interval
dialog
will not have an effect on the
Biomass
line.
Remember that you can also measure the biomass
using the
Biomass
information panel.
Note that biomass is an optional function. In order to
activate the
Biomass
information pane, you must obtain
a software licence.
The biomass line is enabled in the
Echogram
dialog. You can change the scale of the
curve to fit the vertical space available on the echogram.
Related topics
→
on page 59
→
How to establish horizontal markers
on page 84
Range scales
Range scales in the echogram can be enabled in the
Echogram
dialog.
Related topics
→
How to establish horizontal markers
on page 84
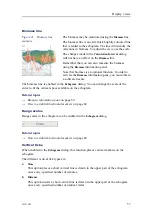
Vertical ticks
When enabled in the
Echogram
dialog, this function places vertical markers on the
echogram.
The different vertical tick types are:
a
Time
This option places a short vertical line is drawn in the upper part of the echogram
once every specified number of minutes.
b
Distance
This option inserts a short vertical line is drawn in the upper part of the echogram
once every specified number of nautical miles.
343539/B
57
Summary of Contents for ES70 - DOWNLOAD AND INSTALLATION REV B
Page 2: ......
Page 128: ...ISBN 13 978 82 8066 118 0 2010 Kongsberg Maritime AS ...

