Getting started
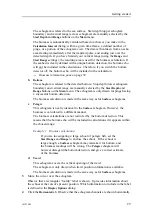
The echogram is related to the sea surface. Start depth (upper echogram
boundary) and vertical range (across echogram) are manually selected by the
Start Depth
and
Range
buttons on the
Main
menu.
The biomass is automatically calculated based on choices you make in the
Calculation Interval
dialog; within a given time frame, a defined number of
pings, or a portion of the echogram view. The data is then taken from an echo
area starting immediately after the transmit pulse, and ending just over the
detected depth. If you have limited your vertical range (using the
Range
and
Start Range
settings), the resulting area is used for the biomass calculation. If
the seabed is clearly defined with a unique bottom detection, the bottom echo
will not be included in the calculations. Therefore, if you switch the bottom
detector off, the bottom echo will be included in the calculation.
→
on page 59
b
Bottom
The echogram is related to the detected bottom. Stop depth (lower echogram
boundary) and vertical range are manually selected by the
Start Depth
and
Range
buttons on the
Main
menu. The echogram is only drawn for pings having
a successful bottom detection.
The biomass calculation is made in the same way as for
Surface
echograms.
c
Pelagic
This echogram is nearly identical to the
Surface
echogram. However, the
biomass is calculated in a different manner.
The biomass calculations are not restricted by the bottom detection. This
means that the bottom echo will be included in calculations if it appears within
the chosen range.
Example 1
Biomass calculation
If you are investigating a large school of pelagic fish, set the
Start Range
and
Range
to enclose the school. If the school is
large enough, a
Surface
echogram may mistake it for bottom, and
the biomass readings will be wrong. The
Pelagic
echogram will
however disregard the bottom detection, and give a correct estimate
of the biomass.
d
Trawl
This echogram covers the vertical opening of the trawl.
The echogram is only drawn when trawl position information is available.
The biomass calculation is made in the same way as for
Surface
echograms.
3
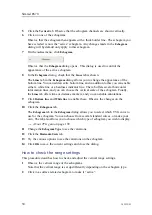
Move the cursor over the echogram.
Observe that a rectangular “tooltip” label is shown. It provides information about
the echoes at the cursor’s present position. Which information to include in the label
is defined in the
Display Options
dialog.
4
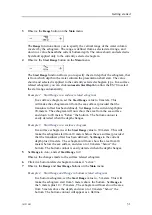
Click the
Horizontal
tab. Observe that the echogram channels are shown horizontally.
343539/B
29
Summary of Contents for ES70 - DOWNLOAD AND INSTALLATION REV B
Page 2: ......
Page 128: ...ISBN 13 978 82 8066 118 0 2010 Kongsberg Maritime AS ...

