background image


13 


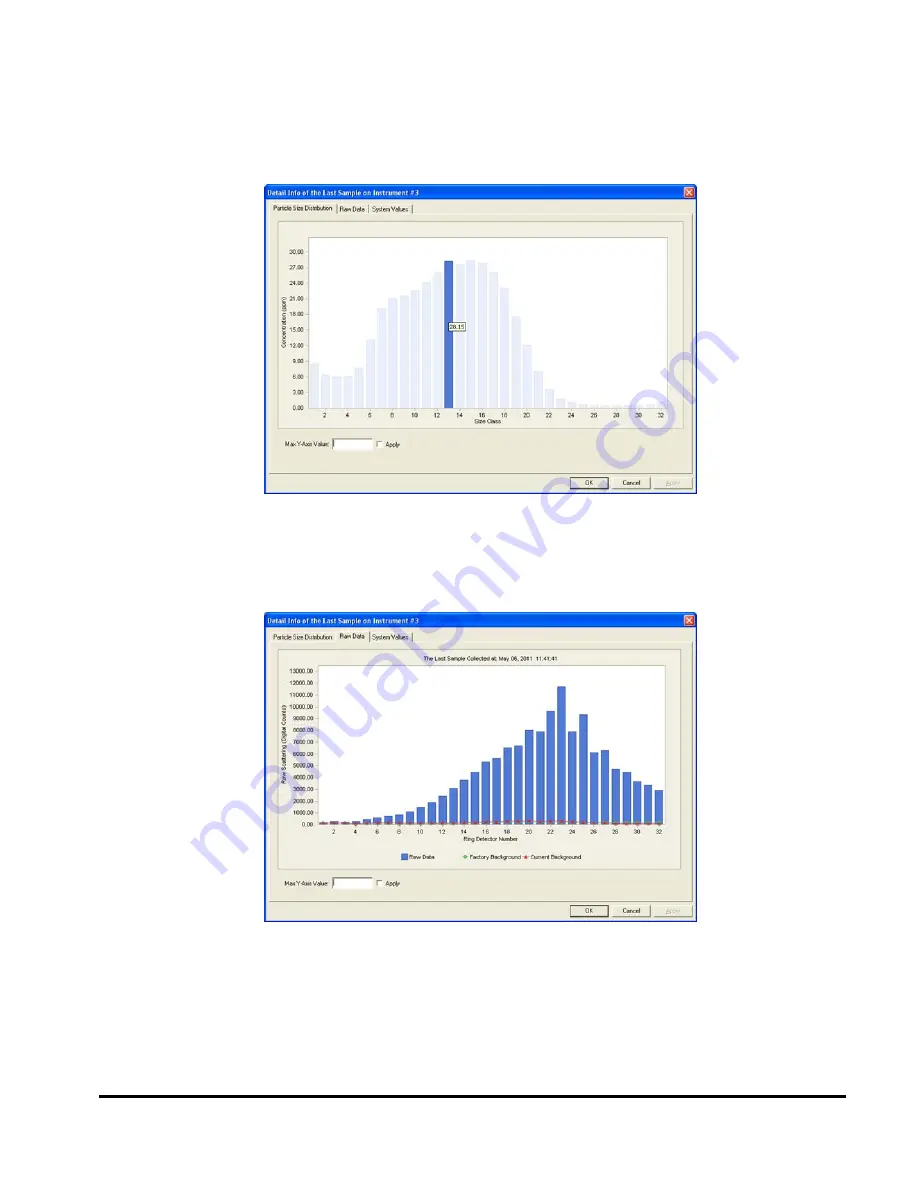
If you are interested in knowing the exact concentration in a size class 
you can move the mouse to the blue bar on the size class of interest 
and hold it there for a second. The other bars will turn light blue and the 
actual concentration in the selected size class will display. In the 
example below, the concentration in size class 13 is 28.15 ppm. 


Step 13: Display 
Raw Data of last 
Sample 


If you click the Raw Data tab (or select Display Raw Data from the 
Display Menu), the uncalibrated raw data from the last sample will 
show. This can be useful for troubleshooting and to get an idea of the 
signal-to-noise ratio in the sample. 


In the Raw Data display, the blue bars show the signal level of the last 
sample (in units of digital counts). The green line (circles) is the factory 
background and the red line (triangles) is the current background. The 
background measurements are always obtained before a sample, using 
water from the clean water tank.  

Summary of Contents for LISST-Hydro

Page 1: ...Hydro Particle Size Analyzer User s Manual Version 2 0 December 2011 Sequoia Scientific Inc 2700 Richards Road Suite 107 Bellevue WA 98005 USA Phone 1 425 641 0944 Fax 1 425 643 0595 info SequoiaSci c...

Page 2: ......

Page 3: ...oftware Section Three provides information about maintenance and troubleshooting Technical assistance For technical assistance please contact your local Distributor or Sequoia if the instrument was pu...

Page 4: ......

Page 5: ...nitor Archive Mode 30 STEP BY STEP PROCEDURES 31 STEP BY STEP DATA COLLECTION WITH LISST INFINITE MASTER CONTROLLER SOFTWARE 32 STEP BY STEP DATA COLLECTION WITH LISST INFINITE MONITOR MASTER CONTROLL...

Page 6: ......

Page 7: ...bmersible pump optional associate power and control hardware a source of filtered water and a Windows based PC running the data collection software LISST Infinite Main optics and control unit details...

Page 8: ...ng This allows the system to turn on the laser and optics and record the optical scattering from the clean water only This background measurement effectively zeros the instrument and compensates for a...

Page 9: ...cell where a measurement of detailed size distribution if performed Once a measurement of detailed size distribution and concentration is obtained the results are transmitted to the PC for processing...

Page 10: ...ewer Mode Two or more instruments If you have two or more instruments connected for example 2 LISST Infinite s or a LISST Infinite and 2 LISST HYDRO s you must use the software called LISST Infinite M...

Page 11: ...finite This CD contains the software necessary to operate the LISST Infinite An install program is included on the CD that will extract the files into the proper locations To start the install process...

Page 12: ...1 LISST Infinite and 4 LISST HYDRO s are connected and sampling The Instrument serial number is listed together with instrument type LISST Infinite or LISST HYDRO For LISST Infinite instruments the t...

Page 13: ...sary for the remaining instruments Step 4 Set Time Between Samples Next on the Instruments tab you need to select the time between samples This cannot be less than 5 minutes In the example above the t...

Page 14: ...centration of 0 l l and a particle size of 0 m correspond to the minimum output signal of 4 mA A loss of signal would then result in negative concentrations and particle sizes which is physically impo...

Page 15: ...click OK Note that also the location of the LisstMstController ini file is displayed here The instruments obtain their calibration constants from this file The user cannot change this location it is...

Page 16: ...rt sampling To start sampling click the Start Button below the Control Panel display in the LISST Infinite Master Controller Software The Start button is the only way to start sampling with the LISST...

Page 17: ...nd instruments 3 5 are pending Step 11 Detailed Data View It is possible to more detailed view the data from the last sample that was obtained by the LISST Infinite Master Controller Software From the...

Page 18: ...lay Particle Size Distribution of last sample The detailed size distribution for the last sample from Instrument 3 then displays The numbers on the Y axis are the sediment concentration in ppm by mass...

Page 19: ...w Data of last Sample If you click the Raw Data tab or select Display Raw Data from the Display Menu the uncalibrated raw data from the last sample will show This can be useful for troubleshooting and...

Page 20: ...iary data from the last sample will show This can be useful for troubleshooting and to get an idea of the overall health of the instrument Step 15 Viewing Time History Strip Charts of Concentration On...

Page 21: ...15...

Page 22: ...ta will be stored if this mode is not running on the computer connected to the LISST Infinite or the LISST HYDRO The Master Controller mode can only be used on a computer that is physically connected...

Page 23: ...e first sample in a new month is obtained The archive file can be viewed using the Archive Viewer mode The display is very similar to the other two modes with the exception that the data will not be u...

Page 24: ...onnected to the network that can access the shared data files skip to Section 2 2 3 LISST Infinite Monitor Archive Mode Step 1 Start program Start the program by selecting it from the Start menu under...

Page 25: ...he software will process the raw data into size distributions and then add a data point to the 4 displays The procedure will repeat at the update rate that was set in Step 3 in section 2 2 2 Step 3 Mo...

Page 26: ...nite but is connected to the network that can access the shared data files skip to Section 2 2 3 LISST Infinite Monitor Archive Mode Step 1 Start program Start the program by selecting it from the Sta...

Page 27: ...ENTRATION TO DISPLAY Step 3 Set update rate Below the settings for the vertical scale is the setting for the horizontal time axis on the strip chart and the Time Between Samples NOTE If you have two o...

Page 28: ...ate rate if you like This value sets the time between measurements Since it can take almost 5 minutes to acquire a new measurement the shortest possible update rate is 5 minutes Enter the desired time...

Page 29: ...o clear the alarm This is calculated by fitting at straight line through the last 5 measurements and finding the time until the alarm level is reached The time is only a prediction based on the curren...

Page 30: ...ler Software to collect data from two or more instruments you must skip this step In the Master Controller Mode raw data is acquired from the LISST Infinite instrument and processed into detailed size...

Page 31: ...tomatically configured as a shared folder You will need to use standard Windows procedures for making a shared folder Consult your network administrator Step 7 Start Monitoring You are now ready to st...

Page 32: ...cles between 1 9 and 381 m 0 0019 to 0 381 mm The time history of these 4 values is displayed on the screen An adjustable warning level can be set for each value see step 4 When this level is exceeded...

Page 33: ...500 microns The date and time of the sample is shown on the title of the display Step 11 View raw light scattering and background light levels To access the raw light scattering for this sample click...

Page 34: ...lity to view the same particle size information displayed on the Master Controller PC from remote locations The only requirement is that the computer in the remote location has access to a shared fold...

Page 35: ...ly update All of the same display features available on the Master Controller are also available on the Monitor computer The only exception is the options effecting sample rates All of the warning mes...

Page 36: ...d and will be in the following format INFyyyymm bin where yyyy is the 4 digit year and mm is the two digit month For example INF200508 bin will be the archive file for August 2005 Open an Archive File...

Page 37: ...rt data collection with the LISST Infinite Master Controller Software Start data collection in Master Controller Mode with the LISST Infinite Monitor Software View data in Monitor Mode with the LISST...

Page 38: ...ings window will be displayed Confirm that the Time Between Samples is set to the desired value Time between Samples set 3 From Settings menu select File Location tab for storing data files 4 Start Sa...

Page 39: ...when the submersible pump is configured to run in AUTO mode where it is controlled to turn on and off automatically the minimum recommend time between samples is 15 minutes Short time intervals could...

Page 40: ...xt command to acquire a sample Data Collection continuing 6 Data collection will continue until operating mode is change to Monitor or Archive mode or if the window is closed Note Minimizing the windo...

Page 41: ...35 Notes...

Page 42: ...vely being updated will provide real time updates of the values in the Monitor mode Click on the check box next to Save as default and Select OK to continue Settings window will be opened and File Loc...

Page 43: ...37 Monitor mode display is very similar to the Master Controller mode display Notes...

Page 44: ...uld start and show four plots with the words No Data Available 2 From File menu of LISSTInfMonitor program select View Archive Select the desired archive file to open Note The file name will be in the...

Page 45: ...ce This chapter contains information about the implications of the warning messages that the system can issue and how to remedy them Section 3 1 explains the various warning messages issued by the sys...

Page 46: ...windows See section 3 2 x Window Cleaning LISST Infinite Dilution Chamber did not fill Clean Water Tank may be empty Readings will resume automatically after Tank is filled This error can stem from 2...

Page 47: ...r High turbidity Optical transmission below 30 Accuracy may be reduced see Manual The measurements will be progressively affected the lower the optical transmission Immediately around 30 transmission...

Page 48: ...ou clean the optics Disconnect the power so that the instrument does not attempt to sample while you clean Then open the front door on the LISST Infinite Step 2 Drain the water out of the system by pr...

Page 49: ...Step 6 Insert the cotton swab into the cleaning port and clean the windows on the right and left Step 7 Replace the cotton swabs several times and use water glass cleaner or mild soap solution to clea...

Page 50: ...ing and the cleaning plug for sealing purposes Step 9 Re Install the optics cell port and fasten the screws Step 10 Fill the optics cell with water The FC command in MotoCross will fill the cell and t...

Page 51: ...45...

Page 52: ...m Bin 1 2 3 4 5 6 7 8 Size 2 06 2 43 2 87 3 39 4 01 4 73 5 59 6 60 Bin 9 10 11 12 13 14 15 16 Size 7 79 9 20 10 9 12 8 15 1 17 9 21 1 24 9 Bin 17 18 19 20 21 22 23 24 Size 29 5 34 8 41 1 48 5 57 3 67...

Page 53: ...file that has 10 columns with data for each LISST Infinite measurement as per the table below Column 1 A 2 B 3 C 4 D 5 E 6 F 7 G 8 H 9 I 10 J Parameter YYYY MM DD HH MM SS MC in largest size range MC...

Page 54: ...eck the Comma box and then click Finish The data will now open up in EXCEL Each row is one measurement and the 10 columns A J are as described above The PSD File PSD is short for Particle Size Distrib...

Page 55: ...9 AM Paramete r YYYY MM DD HH MM SS MC in size bins 1 32 Optical transmission Column 40 AN 41 AO 42 AP 43 AQ 44 AR 45 AS 46 AT Paramete r Voltage Dilution factor 1 if no dilutions took place 2 if a di...

Page 56: ...SEQUOIA or the serial number on a product if applicable has been altered or defaced SEQUOIA shall not be liable for normal wear and tear such as replacement of consumables nor for defects or failure...

Page 57: ...a Product or Products for such purposes if it is unwilling or unable to provide such indemnification 9 Statute of Limitations Customer will not commence any action based on breach of warranty with re...

Reviews: