background image


Tools and Preferences 


102 


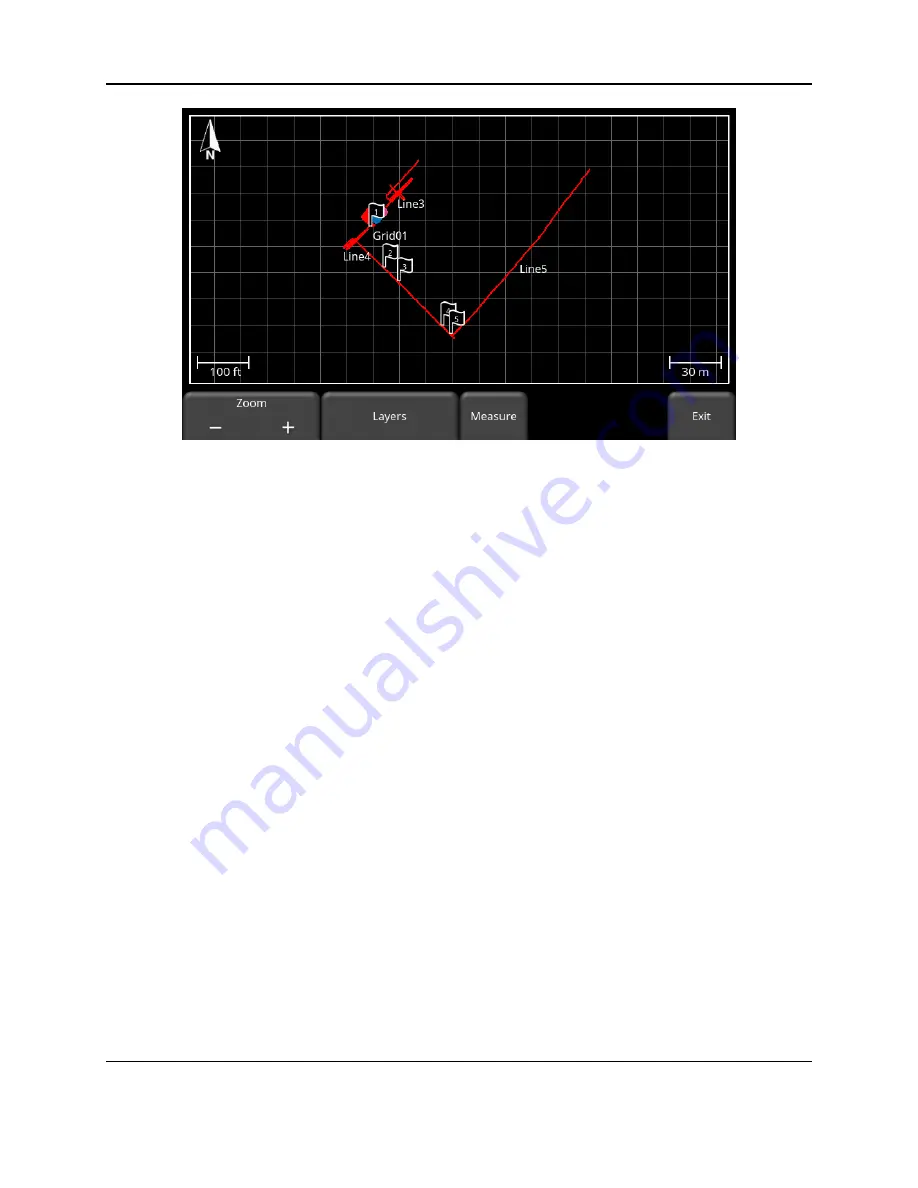
Figure 5-46: MapView showing two grids and multiple lines with interpretations and flags. 

5.3.4 

Delete Project  

Pressing this will delete the currently selected project.  There is a confirmation window asking if 
you are sure; press 

Yes

 to continue deleting, press 

No

 to cancel. 

5.3.5 

Export Data 

Screenshots and data are always saved to the internal memory of the DVL.  When a USB drive 
(memory stick) is inserted into the USB port on the DVL, a message will appear asking if you 
would like to export all data (regardless what screen you are in).  If 

Yes

 is selected, all data is 

copied to the USB stick.  If you need to export data again, the USB stick will need to be 
removed and reinserted.   
 
If 

No

 is selected, the user can enter File Management and export only data from a selected 

project.  Pressing the 

Export Data

 button will copy only the data from the currently selected 

project to the USB-drive.  If no USB-drive is inserted, this option will not be accessible. 


Summary of Contents for pulseEKKO

Page 1: ...2005 00040 09 ...

Page 2: ...ii ...

Page 3: ...65 or register your product online at www sensoft ca product registration Name Company Name Address City State Province Zip Code Country email Phone Fax Component Serial Numbers refer to packing list or the sticker on the component Comp Serial Comp Serial Comp Serial Comp Serial Comp Serial Comp Serial Comp Serial Comp Serial Comp Serial Comp Serial Vendor Name Date Received ...

Page 4: ...Warranty Confirmation iv ...

Page 5: ...ights to all its software and that the SOFTWARE PRODUCT contains proprietary materials protected under copyright trademark and trade secret laws Grant of Software Product License In consideration of payment of the license fee which is the price you pay for the SOFTWARE PRODUCT and your agreement to abide by the terms and conditions of this License Agreement Sensors Software Inc grants to you the L...

Page 6: ...itable for your intended application You assume all risks and liability associated with such use Any statements related to the product which are not contained in Sensors Software Inc current publications or any contrary statements contained on your purchase order shall have no force or effect unless expressly agreed upon in writing by an authorized officer of Sensors Software Inc Sensors Software ...

Page 7: ... trademarks is granted hereunder with the purchase of the PRODUCT or the SOFTWARE PRODUCT license Governing Law In the event of any conflict between any provision in this license agreement and limited warranty and any applicable provincial legislation the applicable provincial legislation takes precedence over the contravening provision This agreement shall be governed and construed in accordance ...

Page 8: ...Confirmation viii Canada L4W 2X8 Tel 905 624 8909 Toll Free 1 800 267 6013 Fax 905 624 9365 E mail customerservice sensoft ca Sensors Software Inc trademarks are listed at www sensoft ca trademarks 1999 00236 04 ...

Page 9: ...y to designated power sources as marked on the battery charger AC adapter The battery charger AC adapter is rated for indoors use only Do not replace detachable MAINS supply cords for the battery charger AC adapter by inadequately RATED cords The exterior of this product should be cleaned using a damp cloth Safety Symbols Consult this documentation in all cases where this safety symbol appears Thi...

Page 10: ...x ...

Page 11: ...Down menu 65 4 5 Quick Start for Collecting Data 67 5 Tools and Preferences 69 5 1 Preferences 70 5 2 System Test 83 5 3 File Management 99 6 System Configuration 105 6 1 GPR Parameters 106 6 2 Survey Parameters 118 6 3 Incompatible Settings 134 7 Collecting Data 135 7 1 Line Scan 137 7 2 Grid Scan 155 7 3 Processing Data 167 8 Slice View 169 8 1 Depth 170 8 2 Line View 170 8 3 Color 171 8 4 Grid ...

Page 12: ...e 201 13 1 General 201 13 2 Cable Care 201 13 3 Battery Care 205 13 4 Electronic Spares 207 13 5 Storage Cases 208 13 6 Upgrading Embedded Software on DVL 208 14 Technical Specifications 211 14 1 Low Frequency Hardware Specifications 211 14 2 High Frequency Hardware Specifications 212 14 3 System Specifications 212 14 4 Battery Specifications 212 14 5 DVL Specifications 213 Appendix A Excerpts fro...

Page 13: ...000 MHz Several antennas and or transducers can be deployed simultaneously when using SPIDAR hardware Multiple configurations and deployment methods provide practical field operation The fully bistatic configuration enables variable antenna offsets and orientations for advanced survey types such as multi offset trans illumination and multi polarization Data is collected and displayed on the new DV...

Page 14: ...Introduction 2 ...

Page 15: ...one for transmitting and one for receiving The one exception is the TR1000 which combines the 1000 MHz transmitter and receiver into a single integrated sensor head The DVL short for Digital Video Logger is a ruggedized field computer that displays and stores collected data All the cable connections including power plug into receptacles on the back of the DVL ...

Page 16: ...2 1 1 Attaching Antenna Sockets to the Transmitter Receiver Insert and tighten the two female brass antenna sockets into the bottom of the transmitter and receiver electronic boxes Finger tighten the sockets do not over tighten These should be checked every time the transmitter and receiver are connected to the antennas as they may get loose during regular field operations Battery port Odometer Ca...

Page 17: ... connect to the brass pins in the antenna Connect the electronics boxes to the mounting block using the two plastic draw latch connectors 2 1 3 Inserting batteries into the Transmitter Receiver Unlatch and then open the two battery covers on the sides of the transmitter and receiver Place one 12 volt battery on each side of each of the electronics boxes Make sure the positive terminal faces inward...

Page 18: ... properly in this orientation Close and latch the battery covers 2 1 4 Attaching Skid Plates to Antennas When using the SmartCart 3 2 or SmartTow 3 3 it is recommended to use antenna skid plates which protect the antennas from damage caused by contact with the ground when moving ...

Page 19: ... antenna skid plates 2 1 5 Attaching Fibre Optic Converters to the DVL Fibre optic cables connect low frequency 12 5 to 200 MHz transmitter and receiver electronics to the back of the DVL First attach the fibre optic converters to the back of the DVL and secure them using the latches shown in the following image Velcro straps ...

Page 20: ...sembly pulseEKKO can use three high frequency shielded bistatic antennas 250 500 and 1000 MHz Each component is a transducer because it consists of both an antenna and either the transmitter or receiver electronics The transmitting transducer is indicated by Tx e g Tx500 while the receiving transducer is indicated by Rx e g Rx500 Fibre optic converter ...

Page 21: ...oned side by side a On a flat surface position the skid plate assembly bottom and two side flanges as shown in the following image 1 Place the transducers onto the bottom skid plate with the labels facing the same direction 2 Place the two transducer flanges onto the skid plate over the mounting posts ...

Page 22: ...Assembly 10 Attach the completed transducer skid plate assembly to the SmartTow 3 3 or the SmartCart 3 2 See section on Connecting Transducer Cables 3 6 3 ...

Page 23: ...ke sure the transmitter and receiver are connected to the antennas The following image displays the complete low frequency pulseEKKO hand held assembly 3 1 1 Attaching Adjustable Handles 1 To attach the adjustable handle to the antenna place the handle blocks over the 4 posts on the antenna and insert the pins to secure Power Cable ...

Page 24: ... 12 2 Adjust the handle height by loosening the two levers by hand 3 Move the handle to the desired height and then retighten the levers 4 Once the handles are adjusted lock them by tightening the levers until they click into place ...

Page 25: ...Assembling Full Configurations 13 3 1 2 Assembling a One Person System The following image displays the One Person System without cables and battery ...

Page 26: ... optional DVL tray can be attached to the either the middle or top bar as shown in the One Person Assembly image Note that one person carrying the whole system can be tiring If a second person is available the DVL can be carried on the DVL Harness 3 7 2 The second person will also carry the belt battery Once this is setup see section on Connecting Fibre Optic Cables 3 6 2 ...

Page 27: ...pidly acquire data in flat and smooth environments The following image shows a completely assembled SmartCart with a frequency of 100 MHz 100 MHz 3 2 1 Unfolding the Handle The Sensors Software SmartCart is shipped in a folded position for easier transportation and storage Refer to the following image while unfolding your SmartCart Handle Support Arm T Shaped Tube ...

Page 28: ...te When folding the SmartCart back up fold the handle down before folding the handle support arm 3 2 2 Attaching Wheels SmartCarts are shipped with the wheels attached If your wheels arrive un attached or have been removed for maintenance or cleaning complete the following procedure to attach them to your SmartCart Press the button on the end of the wheel axle to unlock the axle catches Insert the...

Page 29: ...r 2 Pivot the entire odometer assembly until the small odometer wheel makes good contact with the side of the cart wheel 3 Tighten the screws to lock the odometer wheel in this position 4 Tighten the 1 16 inch set screw into the fibreglass tubing to prevent the odometer from rotating from this position It is always a good idea to recalibrate the odometer 5 2 2 whenever this adjustment is made Tigh...

Page 30: ...artCart with separation bars for low frequency antennas Each system has a unique set of separation bars to attach the transducers or low frequency antennas to the SmartCart and suspend them over the surface Before you begin detach the DVL from the SmartCart and battery as the back half of the cart may fall to the ground and be damaged ...

Page 31: ...ve 1 meter separation bars right while the 100 MHz antennas can be used with either 0 5 or 1 0 meter separation bars 0 5 meter 1 0 meter Refer to the following image to assemble the 0 5m separation bars The 1m separation bars can be assembled in a similar manner You need two user supplied 10mm wrenches for tightening lock nuts onto the bolts ...

Page 32: ...Assembling Full Configurations 20 1 Make sure the Swing Arm bold head is caught by the plastic ridge so it cannot rotate Do not over tighten the Swing Arm needs to move freely Plastic Ridge ...

Page 33: ... Forcing the thumb screw to turn also causes damage If you have damaged the insertion point run a 10 32 tap through the insert to re tap the hole 3 Use the Thumb Screws to attach the separation bars to the front and rear axle SmartCart assemblies Do not over tighten 3 2 4 Attaching the Antennas If the antenna skid plates are not attached now is the time to attach them Use Velcro straps to hold the...

Page 34: ... posts on the antenna and pins Attach the antennas to the SmartCart before attaching the transmitter and receiver with batteries inside to the antennas To complete all cable connections see section on Connecting Fibre Optic Cables 3 6 2 Once completed the assembled SmartCart is shown below with 50 Velcro Straps ...

Page 35: ... each side and are vulnerable to damage see figure below 50 MHz 3 2 5 Attaching Transducer Separation Bars to the SmartCart Before assembling the SmartCart make sure the transducers are assembled on the skid plate assembly 2 2 2 The following image displays a SmartCart with the Transducer Separation Bars attached ...

Page 36: ...they go in straight Note Forcing the screws can strip the threads If the holes are not aligned the thumb screw will bind after half a turn and damage the hole by cross threading it Forcing the thumb screw to turn also causes damage If you have damaged the insertion point run a 10 32 tap through the insert to re tap the hole Use the Thumb Screws to attach the separation bars to the front and rear a...

Page 37: ...Assembling Full Configurations 25 Use the silver U brackets and pins to secure the skid plate assembly to the separation bars as shown below U Bracket Pin ...

Page 38: ...helf on the back of the SmartCart 2 Ensure the battery unit handle is facing the back of the cart and the cable receptacle is on the right The battery should rest in this area without moving 3 Secure the battery onto the cart by placing the straps provided over the battery 4 Fasten the plastic buckle to lock the straps 5 Tighten the straps Once complete see section on Connecting Transducer Cables ...

Page 39: ... Mount on the DVL tray 2 Slide the DVL down onto the mount so that the sides of the mount catch on the DVL back plate 3 The spring loaded release pin will snap into place when secure Do not let go of the DVL until you are sure that it is secure 4 Rotate the DVL to adjust the view angle If it is difficult to rotate slightly loosen the thumbscrews on the bottom of the support shelf Tighten to fix th...

Page 40: ...n It uses a 5 8 11 UNC 1A thread at the top of the pole These are standard for Trimble Topcon and many other GPS units 1 Fasten the U shaped Vertical Support Section onto the tubes on the separation bars and secure it by inserting the 2 quick release pins 2 Insert the GPS mounting post into the top of the Vertical Support Section and secure it with a quick release pin To install and connect the GP...

Page 41: ...3 SmartTow The SmartTow configuration enables you to drag 50 100 200 MHz antennas and 250 500 and 1000 MHz transducers across the surface to acquire data The following image displays a low frequency SmartTow system 100 MHz SmartTow system ...

Page 42: ... frame The instructions below describe how to assemble the Tow Frame 1 Place the Tow Frame Sides so the antenna post blocks are facing outward 2 Connect each piece using the four thumbscrews Be careful to not strip the threads The handle and big wheel odometer are not connected to the frame with thumb screws but held in place once the low frequency antennas are attached Handle Corner Bracket Big W...

Page 43: ... 3 Place the SmartTow frame over the antennas 4 Align and then insert the eight antenna post blocks on the frame into the antenna mounting posts on the antennas 5 Secure the SmartTow frame to the antennas by inserting the pins into the eight post blocks 6 One Person Operation Route the odometer cable along the frame and up the handle Keep the cable away from the electronics and antennas Secure the...

Page 44: ...er cable is routed overtop of the low frequency antennas it can cause banding in the GPR data Banding can often be removed in post processing however if possible we recommend two person operation so the odometer cable does not cross the low frequency antennas 7 Two Person Operation Route the odometer cable behind the wheel odometer to the second person carrying the DVL Odometer Cable Fibre Optic C...

Page 45: ...ibre Optic Cables 3 6 2 to complete those connections Once the SmartTow is assembled connect the round four pin battery cable to the belt battery receptacle 3 3 2 High Frequency Transducer SmartTow The following image displays a pulseEKKO 500 SmartTow 500 MHz SmartTow ...

Page 46: ...of the handle into the trough on the end of skid plate assembly The label on the transducers should be facing away from the handle as shown in the picture above Attach the T end of the handle to the skid plate assembly by placing the U bracket over top and into the vertical slots Secure the handle to the skid plate assembly by inserting the metal pins into the holes at the bottom of the U bracket ...

Page 47: ...eas Big Wheel Odometer Attach the large odometer wheel to the end of the skid plate assembly Look at the label on the tube to ensure that it is installed in the correct orientation To attach the T end of the odometer to the skid plate place the U bracket over top and into the vertical slots To secure the odometer insert the metal pins into the holes at the bottom of the U bracket This is the same ...

Page 48: ...cer cable You can also connect the odometer cable to the back of the DVL but you will need an odometer extension cable this is not recommended as the cables now need to run a longer distance near the antennas Loop the odometer cable so it does not interfere with the rotation of the odometer wheel Calibrate the odometer 5 2 2 to ensure accurate data images Small Wheel Odometer Receptacle on Transdu...

Page 49: ...into the vertical hole on the edge of the skid plate 2 Loop the odometer cable so it does not interfere with the rotation of the odometer wheel Connect the odometer cable to the receptacle on the transducer cable You can also connect the odometer cable to the back of the DVL but you will need an odometer extension cable this is not recommended as the cables now need to run a longer distance near t...

Page 50: ...t using Velcro strips or electrical tape Complete all transducer cable connections as described in the section Connecting Transducer Cables 3 6 3 Calibrate the odometer 5 2 2 calibration to ensure accurate data images Receptacle on Transducer cable Odometer cable ...

Page 51: ...ger kit is attached to the skid plate assembly Ensure that the transducers are secure in the skid plate assembly 2 2 2 before proceeding Each hanger bar has six parallel mounting locations to attach the hanger kits to The hanger kit for each GPR transducer must be mounted in the correct position on the Hanger Bars for proper operation of the system 1 the pulseEKKO 500 hanger kit connects to Hanger...

Page 52: ...the hangers to the hanger bar using the nuts and bolts provided Use two 10 mm wrenches to assemble the hangers wrenches not provided The resulting pictures show the assembled SmartChariot with 500 MHz and 1000 MHz transducers 500 MHz 1000 MHz ...

Page 53: ...sed on the tow vehicle the SmartChariot Handle Assembly can be installed in two different positions Attach the handle assembly to the SmartChariot so the GPR sensor is as level as possible Low Handle Position High Handle Position Attach the handle to the back of the SmartChariot using the two locking pins Locking Pins ...

Page 54: ...ly 1 Determine whether to use the handle in high or low position 2 Find the appropriate side of the handle arm to attach the Ball Hitch Receiver to 3 Align the two white blocks with the handle arm bolt holes 4 Place the Ball Hitch Receiver on top lining up the holes 5 Insert the bolts with washers 6 Tighten the bolts with a 7 16 inch wrench ...

Page 55: ...hen rotating the height adjusters remember the number of turns so you can apply the same number of turns to the other side of the SmartChariot Reattach all the locknuts Do not over tighten the locknuts the skid plate assembly should be free to swing forward and backward During data collection with the SmartChariot on a flat road the skid plate assembly should not come in contact with the ground It...

Page 56: ...long the SmartChariot frame on the same side as the odometer cable Use Velcro straps provided to secure the cables to the hanger bracket 2 Route the cables to the top of the SmartChariot frame and secure with the Velcro straps provided 3 Run the cable along the SmartChariot handle and into the towing vehicle 4 Attach the cables to the back of the DVL in the tow vehicle Odometer Cable 1 Route the y...

Page 57: ...rtChariot Handle Assembly 2 Route the cable along the top of the SmartChariot handle and into the tow vehicle Connect all transducer cables as described in the section Connecting Transducer Cables 3 6 3 Odometer Cable Transducer cables GPS Cable Back of SmartChariot Odometer Cable Connection ...

Page 58: ...h to identify individual pieces of rebar Set step size to a maximum of 5cm to identify this type of pavement structure SmartChariot Odometer Calibration Although typical SmartCart SmartTow odometer calibrations are completed on short lines SmartChariot odometer calibrations should be completed on 20m long lines Zoom Position The SmartChariot can collect GPR data very fast and the data on the DVL s...

Page 59: ... Trigger Method is set to Odometer Section 6 2 3 pressing the trigger button will start and stop data acquisition 2 When the Trigger Method is set to Free Run Section 6 2 3 pressing the trigger button will add a flag 3 When the Trigger Method is set to Manual Section 6 2 3 the button can be pressed to collect one trace of data 3 5 1 TR1000 Handle The TR1000 comes with an optional handle which allo...

Page 60: ...s at the back of the Sensor Head and release them to lock into position Ensure that the cable remains below the handle to avoid stressing it There is an additional set of handle mounting holes at the front of the TR1000 which can be used when scanning a vertical surface or in confined spaces when it is preferable to pull the TR1000 towards the user rather than pushing it ...

Page 61: ...Assembling Full Configurations 49 An assembled TR1000 with handle is shown below When using the handle a harness is typically used to support the DVL in front of the operator Section 3 7 2 ...

Page 62: ...y you are doing 3 6 2 Connecting Fibre Optic Cables pulseEKKO systems use two dual fibre optic cables with the low frequency transmitter and receiver Fibre optic cables typically come in the following lengths 5 meter cables are standard for the Bistatic 3 1 system 2 5 meter cables are used with the SmartCart Assembly 3 2 20 meter cables are used with the 12 5 25 and 50 MHz antennas or for all ante...

Page 63: ...e other end of the cable connects to either receptacle on the back of the DVL To connect the pulseEKKO cables 1 Plug the dual fibre optics cable into the transmitter Make sure the color on the strain relief jacket matches the color of the receptacle door black to black and grey to grey 2 Install the fibre optic connection by pushing gently until the connection clicks into place Attach the other en...

Page 64: ...he receiver and then from the receiver to the transmitter As a result there will be two different cables used 1 Using the cable shown below connect the receiver end to the ports labelled DVL on the receiver by pushing gently until the connection clicks into place Make sure the color on the strain relief jacket matches the color of the receptacle door black to black and grey to grey Receiver end wi...

Page 65: ...end of the fibre optic cable to the fibre optic converter on the back of the DVL The fibre optic connection is keyed and will only attach properly in one orientation 3 The next connection uses a special dual fibre optic cable where both ends are identical ...

Page 66: ... grey to grey 5 Connect the other end to the transmitter again matching black to black and grey to grey You can use an older pulseEKKO 100 transmitter with the pulseEKKO PRO and Ultra Receivers see Transmitters 6 1 6 Note If you are using a pulseEKKO 100 transmitter do not connect the fibre optic output connection on the transmitter 3 6 3 Connecting Transducer Cables Transducer cables connect the ...

Page 67: ...o the transducers Secure the connection with the latch Connect the male end of the transducer cables from the transmitting and receiving transducers to the back of the DVL The electronics recognize which device is connected to which receptacle Secure the cable attachments with latches ...

Page 68: ... transducer cable 3 6 5 Connecting Cables with a TR1000 The TR1000 uses a single cable connected from the back of the DVL to the sensor head However a special adapter cable shown below is first required to connect the two transducer cable receptacles together on the back of the DVL The TR1000 cable is available in variable lengths Connect the male end of the TR1000 cable to the adapter cable The v...

Page 69: ... to collect a trace of data There are several ways to trigger the GPR system to collect a data trace these include Odometer Manual Button and Free Run These options are set in Trigger Method 6 2 3 If the system has an odometer wheel such as the SmartCart SmartTow SmartChariot or TR1000 configurations that is usually the preferred triggering device However for bistatic operation or other special ca...

Page 70: ...e to trigger data collection 3 7 2 Harness The Harness is a convenient option for mounting the DVL when acquiring data using the SmartTow and SmartHandle configurations The DVL will connect to a mounting platform which will then connect to the harness The viewing angle of the DVL can be adjusted to suit the user ...

Page 71: ...e back of the DVL This single cable powers the GPS if this option is turned on in the GPS menu and receives data from it Ensure that the DVL is powered down when connecting or disconnecting the GPS cable NOTE Since the serial port of the DVL outputs power current 1A voltage 12V be very careful if connecting other GPS units to the serial port Verify the pins on the drawing below You can enable or d...

Page 72: ...Assembling Full Configurations 60 ...

Page 73: ...p of the units Figure 4 1 Figure 4 1 Turning on the Transmitter The red Power LED on the top of the unit will flash five times and then stay on to indicate the unit is ready for operation If the unit doesn t turn on check that the transmitter and receiver batteries are fully charged and installed correctly See Section 2 1 3 for details Note If you are not collecting data for more than 15 minutes t...

Page 74: ... 2 Connecting power cable into back of DVL Connect the other end of the cable to a 12 volt power source typically this is either the large battery or the belt battery pictured in Figure 4 3 Figure 4 3 Belt battery left and Large battery right Connect the round four pin power cable to the receptacle on the side of the battery Figure 4 4 When the battery is first plugged in the LED light turns green...

Page 75: ...reen 10 to 20 orange 0 to 10 red The first time you turn on the DVL you will see a Start Up Wizard A series of screen prompts will allow you to setup the language units date time and additional options You will need to enter these settings again anytime you update the embedded software Section 13 6 Every subsequent time the system boots up you will see the main screen Figure 4 6 If the system boot...

Page 76: ...eracting with the DVL Data collection is controlled by the DVL Display The DVL can set survey parameters and collect display and store data It offers touch screen operation as well as a keypad with a number of buttons that can be pressed to perform various tasks Most operations can be done using either the touch screen or the keypad ...

Page 77: ...ctional keypad Controls Up Down Left Right operations in certain menus Camera Saves an image of what is displayed on the screen Asterisk Special Function Used for adding Flags during data acquisition 4 4 Swipe Down menu Figure 4 8 Swipe down menu When the DVL is powered on you can swipe your finger from the top of the screen towards the bottom to display a Swipe Down menu Figure 4 8 with the follo...

Page 78: ...system to a wireless network Volume The Volume and buttons are used to increase and decrease speaker volume Brightness The Brightness and buttons are used to increase and decrease the screen brightness For example increasing the Brightness setting may improve the visibility of the screen in bright sunlight However increasing the screen brightness also increases power consumption thus reducing batt...

Page 79: ...s 5 1 2 to Metric or Us Standard 2 Go to System Configuration 6 and input the Survey Type Antenna Frequency Time Window Depth and Step Size 3 Go into Scope Mode 5 2 5 to set the First Break properly 4 From the main menu select Run System 7 and then select a Project number 5 Enter Line Scan 7 1 to collect individual lines or Grid Scan 7 2 to collect a grid of data and create depth slices 6 When the...

Page 80: ...Getting Started 68 ...

Page 81: ... 5 1 Figure 5 1 pulseEKKO main screen The Tools option allows you to set global Preferences such as language date time and Wi Fi etc conduct System Tests to verify proper component operation and Manage export data files Press Tools to enter this sub menu You will see the screen shown in Figure 5 2 Figure 5 2 Tools menu ...

Page 82: ...ower left side To access parameters not currently shown touch anywhere on the screen and swipe up or down For some parameters it will take you to a sub menu where you can configure the options whereas others will toggle on the screen The parameters are explained below 5 1 1 Language Locale Pressing this button takes you to a sub menu where you can set the language and country region Figure 5 4 The...

Page 83: ... 4 Brightness Adjusts the brightness of the screen Note that increasing the brightness consumes more battery power This can also be changed by using the Swipe Down menu 4 4 anytime the system is not collecting data 5 1 5 Screen Saver A screen saver can be setup to turn off the DVL screen after a period of inactivity to save power The Screen Saver can be set to turn the screen off after 1 minute 5 ...

Page 84: ...utomatically correct for daylight savings time Figure 5 5 Setting the date and time 5 1 7 Bluetooth Press the Bluetooth button to display the Bluetooth set up screen Figure 5 6 where you can pair and connect to a Bluetooth remote It makes it easier to identify the correct Bluetooth device if you turn off other Bluetooth devices nearby Figure 5 6 Bluetooth Configuration screen ...

Page 85: ... on the DVL Once paired it will be displayed on the screen as show in Figure 5 7 To connect to a paired device press Connect Press Disconnect to disconnect from a connected Bluetooth device and press Forget Device to unpair from a paired device Figure 5 7 Bluetooth Device is paired Press Test to confirm Bluetooth device functionality A screen Figure 5 8 will ask you to press a button on the remote...

Page 86: ...lready connected to a Wi Fi network the name of the network is listed beside the Wi Fi Network field in the Preferences menu Figure 5 3 Pressing the Wi Fi Network button takes you to the Wi Fi sub menu Figure 5 9 to connect and configure Wi Fi settings Figure 5 9 Options in the Wi Fi Settings menu The DVL automatically scans for available networks when you enter this menu Use the 4 way directional...

Page 87: ... button is pressed on a selected network it will remove the password and the Network Name will turn white You will also be disconnected if you are currently connected to that network o Scan Scans for any available networks in the area and displays them in order of strength of signal You may need to press this button a second time if you don t see the network you are looking for o Details Press thi...

Page 88: ...play a keyboard where you can enter your GMAIL password Then press OK when done right image in Figure 5 11 Press Save when both the GMAIL Username and Password have been entered Figure 5 11 Entering a GMAIL email address L and password R If everything worked you will see a confirmation message that the email address is setup properly and you are now ready to email mini reports from the field If th...

Page 89: ...display a keyboard where you can enter the name of the server handling the outgoing mail See chart below for some common email providers If your provider is not listed it can usually be found by searching online for SMTP host name provider where provider is the host name e g Yahoo or AOL Press OK when done Press Server Port to display a keyboard where you can enter the port number used by the emai...

Page 90: ...de 1 No Wi Fi connectivity 2 Email address or password was entered incorrectly try re entering these fields 3 Hostname port or SSL setting are incorrect 4 Your email security settings may need to be adjusted which may require you to login to your email account from a PC or mobile device An example of the GMAIL security settings is shown below current as of writing this manual For other e mail prov...

Page 91: ... ensure the setting Allow less secure apps is set to ON Figure 5 14 Figure 5 14 GMAIL security options 5 1 10 GPR Plot Options Pressing GPR Plot Options takes you to a new screen that allows you to set a few options that control how lines are collected and displayed Figure 5 15 ...

Page 92: ...ion distance is reached e g 5m in a 5x5m grid Pressing Auto will set the grid lines to stop automatically Pressing Manual will allow the user to decide when they want to end their line up to a maximum of 50 beyond the normal line length For example if the grid is 20m x 20m and Grid Line Stop is set to Manual the user can collect any line up to 30m long Sometimes you might want to collect a little ...

Page 93: ...ss decay A Constant gain will apply the same amount of gain near the surface as it does deeper allowing you to compare the relative strength of targets at different depths The SEC2 gain is recommended for most cases though a constant gain would be better for transillumination surveys 5 1 11 Reset to Defaults This will reset all system settings preferences back to the default settings Pressing Rese...

Page 94: ...Tools and Preferences 82 Figure 5 17 Option to clear email and Wi Fi settings Figure 5 18 Option to remove all paired Bluetooth devices 5 1 12 Back Returns to the main Tools menu shown in Figure 5 2 ...

Page 95: ...eration of the system Press the touchscreen directly to select which component to test or use the 4 way keypad to highlight the desired option then press Start in the lower left After completing a test there is an indication of whether the system passed or failed the test Each test is described in more detail Figure 5 19 System Test menu ...

Page 96: ...When this is set to ON and the user is connected to a wireless network any system malfunctions will trigger an automatic notification to Sensors Software This helps gather information about any system irregularities and allows us to improve future product releases As the name suggests the notification is completely anonymous and no personal information is sent Clear User Data Pressing this button ...

Page 97: ...rass sandy soil The odometer calibration value is stored in the DVL If the DVL is changed swapped out or has the embedded software upgraded you will need to run the Odometer Calibration test again The image in Figure 5 22 is displayed when you press the Odometer button the options are explained below Figure 5 22 Odometer Calibration screen Odometer Test This test verifies that the odometer is cali...

Page 98: ...re 5 23 Ready to test odometer for a distance of 10 feet Figure 5 24 Odometer Test passed on left failed on the right Odometer Calibration This option calibrates the odometer Choose a set distance on the screen press Start and then move the system that exact distance using a measuring tape or other known distance indicator Press Finish when you have travelled that distance Figure 5 25 ...

Page 99: ...eject to revert to the old value If the value is very different from the expected value the calibration will fail and it will display an error message in red You then have the option to Retry or exit by pressing Back If you exit this menu the old calibration value is maintained Figure 5 26 Results of Odometer Calibration Image on right shows a failure as calibration is way out of range Manual Pres...

Page 100: ...system forward most common or Reverse is used when pulling it backwards Make sure to calibrate in the direction that you will be surveying in 5 2 3 Keypad Test The keypad test ensures that all buttons on the membrane keypad are working Press Start to begin the test which requires the user to press each button once within a 20 second timeframe Figure 5 28 Figure 5 28 Keypad Test ...

Page 101: ...libration followed by a test by pressing Calibrate Both involve touching moving targets on the screen Figure 5 29 Touch Screen test 5 2 5 Scope Mode Scope Mode enables you to confirm that cable connections are correct and all survey parameters are properly set before starting data collection A major component of this is correctly setting the First Break It is highly recommended to run Scope Mode b...

Page 102: ...the bottom of your recording window When using high frequency transducers it is recommended to lift the transducers slightly off the ground This will result in a higher amplitude waveform and make it easier for the Auto routine described below to locate the First Break Press Auto Detect First Break for the system to initiate an automatic search to place the First Break at the correct position Figu...

Page 103: ...arge left or right arrow to continuously move the radar pulse to the left or right Press the same button to stop movement Press the small left or right arrow to manually move the radar pulse to the left or right in small increments Press Advanced to display more options on the bottom of the screen Figure 5 32 If you have the Ultra Receiver you will see the image in Figure 5 33 Figure 5 32 Advanced...

Page 104: ... the vertical axis For the PRO receiver the zoom amplitude shows the range of amplitudes shown i e a Zoom Amplitude of 60 means it shows from 60 mV to 60 mV For the Ultra receiver the zoom amplitude shows a percentage of the amplitude window i e if you have an amplitude window of 50 mV to 50 mV and the Zoom Amplitude is set to 50 it means the image is zoomed in to 50 so it will display 25 mV to 25...

Page 105: ...rage signal level from each trace and is generally applied to high frequency data See Appendix B for more details on GPR signal processing Plot Lines Toggles between plotting the axis lines on or off Persist Lines When this is ON the cumulative radar trace remains on the screen This is essentially plotting one trace on top of the other every time the radar pulses Figure 5 35 If this is OFF only th...

Page 106: ...s selected then the scale goes from 500 mV to 500 mV Unless clipping of the signal is desired the amplitude window should be large enough to encompass the maximum amplitude of the pulse Auto Amplitude Window pressing this button will automatically search for the smallest amplitude window that does not clip the signal and adjust the scale accordingly Figure 5 36 Options after pressing the Amplitude...

Page 107: ...S DGPS RTK RTK Float in increasing order of accuracy Pressing Strings will display the raw data strings that are outputted by the GPS Figure 5 38 as they scroll down the screen The user may select this option to verify the GPS is outputting the proper NMEA string format Figure 5 38 GPS Strings Pressing Clear will clear refresh the screen Press Info will return to the main GPS test menu ...

Page 108: ...Latitude Longitude coordinates GPS Mode pressing this cycles between using the Internal GPS the optional External GPS or turning the GPS off If the External GPS is selected the screen displays additional options Figure 5 40 If the serial port power is On for the External GPS and you change the GPS mode to Internal or Off the serial port power will be turned off as a safety measure Figure 5 40 Conf...

Page 109: ...ormation for post processing with third party software they can set this to All o Serial Port Power the serial port on the back of the DVL can also output power thereby enabling a single cable to be used for the GPS power and data If you use a 3rd party GPS you need to determine if it can accept power via the serial port Important Since the serial port of the DVL outputs power current 1A voltage 1...

Page 110: ... 41 Warning message if you enable power to the serial port 5 2 7 Audio This test ensures that the speaker is operating properly After starting the test you should hear a sound with an increasing pitch Figure 5 42 Figure 5 42 Audio Test ...

Page 111: ...bout to collect a line either in line scan or grid scan which will push the disk usage over 90 a warning message is displayed This will happen again at the 95 threshold The warning message is only given once for each threshold crossing A description of each of the buttons is given below 5 3 1 Project Pressing the and buttons cycles between Projects 1 to 9 along with the Demo project which contains...

Page 112: ... connected to a wireless network and have setup an email account to send from Refer to Section 5 1 9 You will be prompted to enter an email address or you may use the most recent one which will be listed by default Pressing the button to the left of the email address displays the last 5 email addresses used allowing the user to select a recently used email address rather than re entering it Expand...

Page 113: ...essage asking if you are sure Press Yes to proceed 5 3 3 Map View Pressing this will display a map view for all the data lines grids in a given Project provided a GPS was used Figure 5 46 For collected grids Map View is enabled if a GPS internal or external was on during data collection However for lines Map View will only be enabled if an external GPS was used Map View shows the survey path trave...

Page 114: ...VL When a USB drive memory stick is inserted into the USB port on the DVL a message will appear asking if you would like to export all data regardless what screen you are in If Yes is selected all data is copied to the USB stick If you need to export data again the USB stick will need to be removed and reinserted If No is selected the user can enter File Management and export only data from a sele...

Page 115: ...stem Info App log System_summary pdf All screenshot files are saved as JPG files The actual GPR data files are all contained in a GPZ file This can be opened by the EKKO_Project software If data was collected with GPS internal or external a KMZ file is also generated This contains positional information and can easily be opened in Google EarthTM If any Interpretations were made these are saved in ...

Page 116: ...Tools and Preferences 104 ...

Page 117: ...tton on the bottom or touch the blue button with the pencil icon beside the configuration name at the top Use the pop up keyboard to edit the name and then press OK to accept To create a new configuration press the New Copy button The user has the option to create a new configuration with default settings associated with a chosen frequency or copy the current settings and use that as a starting po...

Page 118: ...he objectives of the survey As frequency decreases the depth of investigation generally increases but spatial resolution decreases Therefore the ideal survey will be one that uses the highest frequency that adequately penetrates to the target depth The following table offers a guide to frequency selection The values are based on practical experience and should be used as an approximation only Cent...

Page 119: ...e survey target An entire survey could fail if the window is not sufficiently long enough to sample to the depth of the target Conversely too long a time window increases the data volume and can make data hard to interpret Remember that setting the Time Window or Depth to a certain value does NOT guarantee that the GPR signals can penetrate to that depth It only means that the GPR receiver will li...

Page 120: ... users are more comfortable relating to depth The calculated scan depth uses the velocity set in the system configuration settings based on the approximate equation Depth Velocity x Time 2 The following table shows the default and maximum time window for each frequency as well as the approximate scan depth assuming a material propagation velocity of 0 1 m ns 0 328 ft ns Frequency MHz Default Time ...

Page 121: ... 4 Setting the Antenna Step Size The following table displays default values based on frequency Frequency MHz Recommended Step Size m Recommended Step Size ft 12 5 2 5 25 1 3 50 0 5 1 5 100 0 25 1 0 200 0 1 0 5 250 0 05 0 2 500 0 02 0 1 1000 0 01 0 05 CMP or WARR Surveys When the Survey Type 6 2 1 is set to CMP or WARR the Step Size parameter defines the total incremental distance between the ante...

Page 122: ...aveform It is expressed as a time interval in picoseconds between points on a trace 1000ps 1ns Antenna frequency affects the sampling interval higher frequencies are sampled at a finer time interval than lower frequencies Figure 6 5 to accurately capture the resulting waveform Figure 6 5 Low frequency signals require a longer sampling interval left whereas high frequency signals require a shorter ...

Page 123: ...ction It is rare for the user to change this value unless they have specific requirements The following table displays recommended temporal sampling interval for different frequencies Center Frequency MHz Recommended Sampling Interval ps 12 5 6400 25 3200 50 1600 100 800 200 400 250 400 500 200 1000 100 6 1 5 Stacks In noisy environments one way to improve the signal to noise ratio is to collect m...

Page 124: ... data quality but may slow down survey production The more stacks the longer it takes to collect data at each survey position It is important to find the ideal number of stacks that adequately detect the target Press Stacks to display the screen in Figure 6 7 where this value can be set The current number of stacks is displayed Press the and buttons to change the value With the Model 1600 receiver...

Page 125: ...alking speed generates data of good quality This is essentially automatic stacking of the data DynaQ is only available if the Trigger is set to Odometer 6 2 3 Details are further explained in the Section 7 1 1 6 1 6 Transmitter This setting allows you to specify which transmitter is being used for data collection Several different transmitters can be used with a pulseEKKO system Press Transmitter ...

Page 126: ...ge cycles between Level 1 and Level 5 where Level 1 is the lowest voltage used and Level 5 is the highest If the VP transmitter is set to Auto it will use the highest voltage the transmitter can generate Remember that sometimes you may want to reduce the power to prevent the receiver from being saturated at shallow depths for example when using 50 MHz antennas with a 0 5m antenna separation Unless...

Page 127: ... noise level 6 1 7 Receiver This setting allows you to specify which receiver is being used for data collection Pressing Receiver will display the screen in Figure 6 10 Figure 6 10 Selecting the type of Receiver The pulseEKKO PRO receiver is the conventional receiver used in the models specified If this is the one connected select this and then press Back ...

Page 128: ...ocity or know the type of soil conditions you can set it by pressing Velocity to display the screen in Figure 6 11 where the velocity can be set Figure 6 11 Setting GPR velocity in US Standard units The table in Figure 6 11 shows typical velocity values for various soil media It will display in whatever the selected measurement Units 5 1 2 are The current velocity setting is shown at the bottom of...

Page 129: ...ft ns Air 0 30 0 98 Ice 0 16 0 17 0 52 0 56 Dry Soil 0 15 0 419 Dry Sand 0 15 0 49 Granite 0 13 0 43 Dry Salt 0 13 0 43 Dry Rocks 0 12 0 39 Limestone 0 12 0 39 Wet Rock 0 10 0 33 Concrete 0 08 0 12 0 26 0 39 Pavement 0 10 0 33 Shale 0 09 0 30 Silt 0 07 0 23 Wet Soil 0 06 0 20 Wet Sand 0 06 0 20 Clay 0 06 0 20 Fresh Water 0 033 0 11 Sea Water 0 033 0 11 ...

Page 130: ...flection mode is shown Reflection This is the most common survey method The Transmitter and Receiver antennas are maintained at the same separation distance and are moved in tandem to create a cross sectional profile Whether you are using the SmartCart SmartTow or in Bistatic mode the principle of operation is the same CMP Short for Common Mid Point this survey is performed when you want to determ...

Page 131: ...away at set intervals This can sometimes be easier where space is a constraint since only one antenna needs to move however you need a more uniform reflector than a CMP Setting up a WARR survey requires the Start Offset 6 2 2 Starting Antenna Separation 6 2 4 and Step Size 6 1 3 parameters to be set For details of conducting a WARR survey see Section 6 2 1 and Section 11 Transillumination ZOP MOG ...

Page 132: ...eaningful results Transillumination ZOP Short for Zero Offset Profile The transmitter and receiver are moved in sync or equal steps Another example is if you are scanning a column Figure 6 14 as you move the transmitter 10cm up the column the receiver also moves the corresponding distance in the same direction Transillumination MOG Short for Multi Offset Gather The goal for this survey is to gener...

Page 133: ...radar the transmitter is on the surface and the receiver is moved down the borehole The transmitter is then moved to another position at a specified interval on the surface and the process is repeated Refer to the Borehole GPR manual for more details 6 2 2 Start Offset Reflection Surveys Normally most lines start at position zero however you may want to specify a start offset for a given line e g ...

Page 134: ... the survey centered at a position that corresponds to a position along a previously collected reflection survey line If so set the Start Offset Position to that value for example 175 5m WARR Surveys If using a measuring tape to position the transmitting and receiving antennas for the survey layout the measuring tape on the ground and set the start position to a nice round number on the measuring ...

Page 135: ...er Method Odometer If you have a setup containing a wheel then you will likely use this option As the odometer wheel moves one step size it will cause the transmitter to fire This is the easiest mode to operate in as you don t have to worry about collecting data at equally spaced intervals Pressing the Edit Odometer button takes you to the screen in Figure 6 17 where you can setup and calibrate th...

Page 136: ...ch measurement point the system assumes the operator has moved the antennas one step size along the survey line When this option is selected the user can trigger the system either with a Bluetooth remote by pressing the Up or Down button on the 4 way keypad Figure 6 18 Figure 6 18 Selecting the Manual Trigger Pressing Setup Bluetooth will take you to the menu in Section 5 1 7 where you can connect...

Page 137: ... Pressing Free Run will display the screen in Figure 6 19 Figure 6 19 Free Run Trigger method The trace interval time between pulses can be varied from a little as 0 01s up to 60s It is based on Distance Travel Speed x Trace Interval The user has the option to control the trace interval or the travel speed such that the programmed step size distance is maintained In the example in Figure 6 19 the ...

Page 138: ...n Free Run mode data is collected even when the system is not moving so proper data collection relies on the operator moving the system at a consistent speed Positioning this way is reasonably accurate but not very precise because the system movement speed usually varies It is a best practice to have a secondary means of positioning the data for example a GPS or adding Flags 7 1 10 at known positi...

Page 139: ...esired time Stop After Trace Allows the user to define a set number of traces to collect before the system stops giving the user an opportunity to make changes or adjustments for example Data collection on this line cannot be continued after this a new line must be started Use the and buttons to set the desired number of traces Figure 6 22 or it can be set to OFF Figure 6 22 Pausing data collectio...

Page 140: ...eparation Press the and buttons under Antenna Separation to set the desired separation values It will cycle through common pre set values Press Custom Value to enter a specific antenna separation value In general the recommended antenna separation should equal the antenna length For example for 100 MHz antennas which are one meter long the separation should be set one meter apart If the antenna se...

Page 141: ... the pulseEKKO antennas and transducers have the flexibility to allow different orientations with respect to each other Press Antenna Polarization to display the screen in Figure 6 25 where the user can set the Antenna Geometry Most surveys are conducted in the Broadside Perpendicular configuration This is because the maximum amount of energy transmitted and received is perpendicular to the long a...

Page 142: ...ns explained below Broadside is the typical configuration that most people use for reflection surveys This provides the best coupling between antennas and reduces reflections from targets off to the side Figure 6 25 Endfire has the antennas in a line Figure 6 26 This is sometimes used for larger antennas where space is a consideration Cross polarization orients one of the antennas transmitter or r...

Page 143: ...ry is Endfire Perpendicular Figure 6 27 Antenna Polarization is Cross polarization Tx Parallel Rx Perpendicular Press Orientation to toggle between Parallel and Perpendicular This refers to the orientation of the antenna relative to the survey direction ...

Page 144: ...f the Transmitter and Receiver antenna Press Rotate Tx Rx to rotate them both by 90 degrees Successively pressing this will also switch the positions of the Tx and Rx once it reaches 270 degrees Press the and buttons under Tx Rotation to rotate the Transmitter by 90 degree values Press the and buttons under Rx Rotation to rotate the Receiver by 90 degree values Press Reset to Default to return the...

Page 145: ...9 Transducer showing the Electric field vector 6 2 6 GPS Press GPS to enter a menu where you can setup and configure the GPS Figure 6 30 This is same menu for the GPS test see Section 5 2 6 for more details Figure 6 30 GPS Configuration ...

Page 146: ...t is recommended to go back into System Configuration and correct the settings If you exit without fixing the warning message will appear again when you go to collect data In Figure 6 31 the user received an error message when they tried to set Stacks to DynaQ with the Trigger option set to Manual Figure 6 31 Warning message when exiting System Configuration ...

Page 147: ...er and name shown at the bottom Figure 7 1 Preparing to collect data The user has the option to collect Lines and or Grids in a given project depending on the survey type selected Grids can only be collected in reflection mode surveys Line Scan and Grid Scan operation are described below If no antenna or transducer is detected you will see the screen in Figure 7 2 The only difference is that the S...

Page 148: ...d of Scope It is highly recommended to Scope the system before data collection Scope mode ensures the GPR pulse is properly positioned within the recording time window Press the Scope button to enter Scope Mode The details of scope mode are described in Section 5 2 5 ...

Page 149: ...7 3 Preparing to Line Scan Some details about the system configuration are displayed along with the project number name and line number Press the and buttons under Line Number to switch to a different line number Press Start to enter data collection mode To collect data without saving press No Save Mode Section 7 1 15 The GPS Status indicates which GPS is currently selected as well as the quality ...

Page 150: ...ed or pulled along a straight line the collected GPR data scrolls onto the screen from the right and moves to the left Figure 7 5 shows the depth scale along the side of the GPR Line image and the position scale along the top of the image The units are set to Metric or US Standard units based on the setting in the Section 5 1 2 The depth scale can also be changed to a time scale with units of nano...

Page 151: ...touches the screen or presses a button on the keypad the menu reappears If the user collects data too fast for the given settings the system may skip data traces This usually happens if one or more of the following conditions exist 1 The Scan Depth time window is set to a deep value 2 Step size is less than the recommended value 3 Stacking is set to a high value Where the traces skipped there are ...

Page 152: ...r at the bottom of the screen In most situations moving the system at a comfortable walking speed generates data of good quality In situations where target resolution or maximum penetration depth is critical moving slower increases data quality As the Line Scan data scrolls on the screen the DynaQ Index Bar is displayed along the bottom of the screen Figure 7 5 The color of the bar indicates the q...

Page 153: ... line corresponds to the location at the center of the GPR sensor As you pull the system backwards the Position Indicator moves to mark the current location of the cart in the image A box appears with the current position relative to the start of the line listed as the top number Figure 7 8 Back up Indicator and Depth Indicator shown Depth Indicator A short red horizontal line corresponds to the c...

Page 154: ...mation about a different point on the screen simply touch and drag the box or cross hair to the desired position This is available regardless of what trigger is selected Figure 7 9 Touch the screen for 2 seconds to get depth and horizontal position at any point 7 1 4 Zoom This button controls the horizontal and vertical scaling of the displayed GPR data Pressing the Zoom button opens a sub menu wi...

Page 155: ...s under Time will allow them to change the displayed time window Figure 7 11 Changing the displayed time Position Pressing and under the Position button allows you to change the length of data display on a single screen This is also known as horizontal scaling One reason for setting this higher would be to fit more data on the screen and look for consistency among hyperbolas that were crossed Figu...

Page 156: ...layed as the color palette changes A few sample color palettes are shown in Figure 7 13 Figure 7 13 Changing color palettes 7 1 6 Filter The Filter is a background subtraction filter used for removing flat lying responses in the data Filtering helps identify shallow targets that might be masked by the strong signals at the top of the image as well as possibly enhancing the visibility of hyperbolas...

Page 157: ...ilter Only the longer flat lying features get removed The higher the number the shorter the filter width and the more aggressive the filter This results in the removal of long and short flat lying features Pressing OFF turns the filter off completely Figure 7 14 Showing variable filter lengths and Filter Off 7 1 7 Gain Since the material being scanned absorbs the GPR signal deeper targets return w...

Page 158: ...eath the word Velocity Crossing linear targets like pipes or cables at a 90 degree or right angle produces a hyperbola suitable for velocity calibration The value obtained is used to compute a depth estimate of a target These depths will be incorrect if the calibration is performed on a target hyperbola produced at an oblique angle rather than a right angle Once you have a hyperbola on the screen ...

Page 159: ...elocity while in backup mode Image on left shows initial hyperbola that appears while the one on the right has the correct hyperbola fit On the other hand if you press Velocity while you are collecting data or have pressed Stop you will see a red hyperbola in the middle of the screen Touch and drag the hyperbola so it lies over a hyperbola in the data image Figure 7 17 You can use the 4 way keypad...

Page 160: ... collected line you can touch anywhere on the screen to add an Interpretation Figure 7 18 This appears as a dot of the current Interp color To change the color press the Interp button to see a selection of colors and to select a new one Figure 7 19 To remove an Interp ensure the same color is currently active and simply touch the Interp to delete it These field interpretations get exported with th...

Page 161: ... record the position and name of the object encountered at each marker in your field notebook or voice recording When a GPR line is collected in Free Run flags are often added to mark known positions This allows the GPR line to be rubberbanded in post processing to correct the position of the traces and the length of the line Pressing the asterisk button on the keypad will insert a flag at your cu...

Page 162: ...he data saved is the raw data all the viewing parameters that were changed do not alter the saved data in any way Use the Left and Right directional arrow buttons to scroll and view data not currently displayed on the screen Press Back to exit this screen 7 1 12 Viewing collected lines Once you ve exited the collection screen you may choose to view previously collected lines ...

Page 163: ...a preview of the line scan image on the right Figure 7 21 Press View to open the selected Line in Line Scan mode You cannot add data to it but you can change some of the viewing parameters and add Interps Press Additional Info to see extra information regarding the collected line e g Antenna geometry step size etc Figure 7 22 Figure 7 22 Pressing additional information Press Delete to delete this ...

Page 164: ... Bluetooth remote or the DVL keypad buttons to fire the transmitter As each trace is collected the transmitting and receiving antenna positions update move the antennas accordingly and fire the transmitter again Repeat this process until your CMP survey is completed Note that for a CMP survey Interps are not available If a CMP is done correctly over a constant subsurface reflecting layer you shoul...

Page 165: ...screen the parameters for the data collection are initially displayed in the left of the window The right side of the window displays a graphic showing the initial position of the antennas Figure 7 25 left In this example a Zero Offset Profile ZOP is shown Press Start to begin data collection As you collect data the new positions of the transmitting and receiving antennas are shown For transillumi...

Page 166: ... of Transillumination MOG left After all receiver positions are collected the transmitter is moved 0 1m right and the process repeated 7 1 15 No Save Mode From the Line Scan menu Section 7 1 there is the option to collect data in No Save Mode No Save Mode means that data collected is NOT saved but screenshots can still be taken with the Camera button These screen shots get placed in the currently ...

Page 167: ...ta in an organized grid over a defined area allows the data to be presented as plan maps or in 3D This is useful for locating all subsurface objects as well as their orientation in a graphical manner that is easy to interpret From the main menu ensure you are in the desired project then press the Grid Scan button to enter the Grid setup menu 7 2 1 Grid Setup The setup screen in Figure 7 28 allows ...

Page 168: ... in red on the right side Grids that are partially complete will also show the uncollected lines in green on the right side 7 2 2 Grid Settings Pressing the Grid Settings button will change the bottom menu allowing you to set specific parameters for your grid Figure 7 29 When doing this keep in mind the size and orientation of objects that you are looking for as well as the frequency of the sensor...

Page 169: ...nt lines Note Target size determines line spacing In most cases the system must pass over a target to detect it line spacing needs to be on the order of the size of the target or smaller when practical Line spacing can be further apart for larger targets or targets with a linear extent These rules may have to be relaxed for practical purposes such as survey production rates Tighter line spacing ta...

Page 170: ...omize some further settings explained in next section 7 2 3 Grid Settings Custom Pressing Custom from the previous screen changes the bottom menu allowing you to define a custom grid size and line spacing Figure 7 31 Figure 7 31 Custom grid setup can vary dimensions of X Y axes as well as line spacing ...

Page 171: ...llection Press Start when all the grid parameters are setup and data collection is ready to begin If you select a previously collected partial grid Figure 7 32 pressing Start takes you into that grid and data collection resumes where you left off Most configuration settings will need to be the same in order to continue a previously started grid e g frequency step size etc If at least 3 lines are c...

Page 172: ... the diagram below start at the origin and measure out A and B C is calculated on the DVL screen using the formula C2 A2 B2 Add the length of C to your measurement and pull the tape so that it returns back to the origin A table with calculated distances is shown for some different grid dimensions Once the grid is measured the line spacing needs to be marked on the ground either with paint or using...

Page 173: ...stent on every line Line up the mid point of the pulseEKKO antennas or transducers with the starting line Figure 7 35 and then press Start Wait for the screen to change as shown in Figure 7 36 Then push the system straight towards the end of the line It is helpful to have a marker at the end so you have something to aim for Figure 7 35 Lining up Cart properly on grid lines shown as red dashed line...

Page 174: ...The left half of the screen initially displays some parameters related to the grid Figure 7 36 Grid collection screen prior to any data collection Press Start when you are positioned at the start of the line Push the system in a straight line towards the end of the line Figure 7 37 If Grid Line Stop 5 1 10 is set to Auto the system will automatically stop acquisition once that distance has been co...

Page 175: ... next line to be collected in white The remaining lines to be collected are shown in green Figure 7 38 Figure 7 38 After first line has been collected Move to the start of the next line and repeat the process The grid image will always display the line number e g Y1 and the position of your line relative to your origin Once all the lines are done in one direction it will automatically prompt you t...

Page 176: ...ary to recollect a line if you make a mistake To recollect a line select it and press Start You will be prompted with a message asking if you want to overwrite that line Figure 7 39 Press Yes to proceed Figure 7 39 Overwriting a line To change the way a line is viewed displayed select it and press Line View This displays the selected line in the Line Scan screen Figure 7 40 From here you have the ...

Page 177: ...ne to do this This takes you to a screen shown in Figure 7 41 Figure 7 41 Addling lines to a pre defined grid before adding lines left and after right Pressing Add X Line or Add Y Line adds a respective line in the X or Y directions at the end of the grid Press the same button repeatedly to add multiple lines There is the option of specifying the direction of the newly added line by pressing the L...

Page 178: ...re the obstruction is but there will be data before and after it When you approach the obstruction terminate the line by pressing End Line If you collect less than 95 of the expected line distance the system assumes there is an obstruction and will give you the option to collect a reverse line For example in Figure 7 42 LineY3 was incomplete so it gives the user the option of collecting a reverse ...

Page 179: ...roceed and create the depth slices Figure 7 43 Processing depth slices with the correct velocity value If not then it is recommended to press Cancel and adjust the velocity by using a representative hyperbola on one of the collected lines Then return and press Slice View and press OK to proceed and create the depth slices If the collected grid is too large to process the depth slices on the DVL wh...

Page 180: ...Collecting Data 168 ...

Page 181: ...eft sides The left half of the screen displays one of the grid lines and any flags or interpretations that were made The line number is overlaid on the bottom of the image and corresponds to the white line on the grid LineY5 in Figure 8 1 To move to another grid line use the 4 way directional keypad on the DVL the highlighted line is white The shaded area in between the horizontal red lines corres...

Page 182: ...ll recalculate and re process the depth slices 8 2 Line View Pressing the Line View button displays the currently selected GPR line as a full screen image All the functionality of Line Scan such as Zoom Color Filter Gain Velocity and Interps are available here Figure 8 2 Use the 4 way directional keypad to change to a different line Figure 8 2 Changing Line View settings from within Slice View Pre...

Page 183: ...een the 9 available color palettes available on the system b Gain Function cycles between LOW MEDIUM and HIGH A setting of HIGH is useful for revealing weaker targets which may be difficult to see Setting to LOW will help clean up the data and only show the strong targets but will hide some of the weak signals so be careful when setting to LOW Figure 8 3 shows the variations in color sensitivity ...

Page 184: ... Lines Pressing this button overlays grid lines on the depth slice image and cycles between ON PARTIAL or OFF When set to ON all the collected lines are displayed When set to PARTIAL only some of the grid lines are displayed This may be necessary for some larger grids as having all the grid lines ON tends to obscure the image beneath Figure 8 4 When set to OFF only the currently selected line is d...

Page 185: ...Slice View 173 Figure 8 4 Varying the Grid Lines from top to bottom ON PARTIAL and OFF settings ...

Page 186: ...f so you need to enter the Grid Scan 7 2 menu again and select the appropriate grid number and press Start the grid number will be in red since data exists Select the grid line that needs to be recollected When you press Start it will display a prompt confirming if you want to overwrite the line After recollecting the grid line s press the Slice View button to re process the grid data into depth s...

Page 187: ...is connected both line and grid data will be shown 9 1 Accessing Map View Map View is project based and displays all grids and lines collected in a project A project will typically contain all the data collected at a given site Map View can be accessed either from the Run System screen Figure 7 1 or from the File Management menu Figure 9 1 The Map View button is only available if data exists in th...

Page 188: ...the bottom menu Figure 9 3 allowing you to turn on off various items in the Map View image Figure 9 3 Pressing the Layers button reveals further options currently all are turned on Map Lines Toggles background grid lines ON or OFF Flags Toggles flags ON or OFF Interps Toggles Field Interpretations ON or OFF Lines Toggles Line Scans ON or OFF ...

Page 189: ...r finger a certain distance to get a measurement value for that distance yellow line pointed at by the white arrow in Figure 9 4 The distance value is displayed in the top right corner Pressing the Measure button again exits from Measure mode and removes the yellow measured line and the measured value Figure 9 4 The white arrow points to the measure line The measured distance is shown in the top r...

Page 190: ...Map View 178 ...

Page 191: ...ame project number as the data Figure 10 1 Message displayed after pressing the camera button on the DVL to capture the screen no Wi Fi present If you are connected to a wireless network and have a sending email address configured the user sees the message in Figure 10 2 asking if you would like to email the screenshot and prompts you to enter the email address The email address defaults to the la...

Page 192: ...Managing Data 180 Figure 10 2 Message after pressing the Camera button on the DVL when connected to a wireless network The user can enter an email address to send the mini report to ...

Page 193: ...eports When a screenshot is emailed it is sent as part of a mini report This mini report also contains a table with information about the collected data including the settings used date time Figure 10 3 Figure 10 3 Example of a Mini Report ...

Page 194: ... 0 for example this involves going to Settings Personal Hotspot Figure 10 4 Ensure that the Personal Hotspot setting is turned on and wait on this screen until the connection has been established Once you have received confirmation on the DVL the cell phone can resume normal use Figure 10 4 Setting up hotspot on an iPhone Note that when setting up a Personal Hotspot you may be disconnected from an...

Page 195: ...USB port on the DVL to export data Once the USB drive is recognized a message appears informing you that a drive has been inserted and will ask if you wish to export all the data on the DVL to it Figure 10 6 Click Yes if you wish to proceed Figure 10 6 When a USB drive is connected to the DVL a message opens asking if you would like to export all your data to it USB memory stick ...

Page 196: ... file Project2 KMZ file Field Interp Report CSV System Info All screenshot files are saved as JPG files The GPR data and other support files such as GPS files are all contained in a GPZ file This file is opened with the EKKO_Project PC software If data was collected with GPS internal or external a KMZ file is also generated This contains positional information and can easily be opened in Google Ea...

Page 197: ... process and create reports from your GPR data Grid data that is processed in the field will show up as depth slices in EKKO_Project as well as the path travelled in MapView From the main screen Figure 10 7 you can access various views and launch modules that give you access to further functionality For more information consult your EKKO_Project manual or contact Sensors Software www sensoft ca Fi...

Page 198: ...Managing Data 186 ...

Page 199: ... by setting the Trigger Method 6 2 3 to Manual and have the DVL operator using the DVL buttons or a Bluetooth trigger It is also possible for the operator moving the antennas to use the Bluetooth trigger to collect data Another option is to set the Trigger Method 6 2 3 to Free Run mode with a time delay between traces The antenna operator needs to move the antennas one step size to the new positio...

Page 200: ...nnas can be moved to their next position in preparation for the next trace Figure 11 2 Using string to keep antennas at fixed separation Fibre optic cables can be broken or damaged if care is not taken The most common breakage point is right at the connectors when the cables are snagged or pulled hard Protect the fibre optic cables by making a strain relief Take an extra loop of cable and fix it t...

Page 201: ...ed on the starting position for the survey line b The data collection screen on the DVL should display Press Trigger c The operator presses the up or down button on the DVL or they can use the Bluetooth trigger d The system starts to beep indicating the data trace is being collected The antennas should be kept in contact with the ground surface while the system is beeping e When the beeping stops ...

Page 202: ...part of GPR surveys is accurately locating subsurface objects When an odometer is used as in the SmartCart SmartTow or SmartChariot systems this is easy as the GPR is triggered via the odometer at regularly spaced intervals However when using a full bistatic configuration the user needs to manually trigger the system at periodic intervals In most cases a measuring tape is used to control position ...

Page 203: ... When the 1 meter separation bars are used the front end of the SmartCart gets quite heavy and can be damaged if the front is tilted up To maneuver the cart lift the back end and rotate to change the cart direction Figure 11 3 1 Move Antenna to this point 2 Move this antenna until the rope is tight Step Size Distance Marker on rope Survey Direction ...

Page 204: ... Endfire and Cross Polarization Antenna orientation can be Parallel or Perpendicular Details are explained in Section 6 2 5 The most common setup is the perpendicular broadside configuration This orientation provides the best coupling between antennas and linear targets perpendicular to the survey line It also provides the most coverage of the radiation pattern along the survey line Figure 11 4 Fi...

Page 205: ...ntenna separation to increase the signal path length from the mid point reflector Figure 11 5 Figure 11 6 Figure 11 5 Illustration of a CMP Survey Figure 11 6 Actual CMP Survey The resulting data can then be processed using a semblance analysis routine to extract average GPR velocities to the reflectors Figure 11 7 The extracted velocities are used for adding an accurate depth axis for other GPR s...

Page 206: ...Surveying Techniques Tips 194 Figure 11 7 Data from CMP survey left and semblance analysis used to extract velocity right ...

Page 207: ...e 12 1 and that they have clicked into place Figure 12 1 Make sure fibre optic strain relief color matches the receptacle door color grey to grey and black to black Also ensure that the software settings for the transmitter are correct for the transmitter that you are using with the system Reset the System by Powering Down If the connections are OK but the error persists try powering down the syst...

Page 208: ... should run about twice that time on a pair of batteries Low Battery Indicators There are 2 ways that a low battery voltage is communicated to the operator 1 When the transmitter and receiver battery voltages drop below 11 4 volts the DVL displays a warning message as the system initializes at the start of the GPR survey line The operator can continue to collect data but should consider changing o...

Page 209: ...ommunication failure between the DVL and the transducers antennas Power off the system and disconnect the battery Make sure cables are not visibly damaged Check that all pins are straight and there is no dirt or debris in the connector Ensure that the cable connections are tightly secured Sometimes vibrations cause the cable connections to slightly loosen and break contact leading to errors Discon...

Page 210: ...p of the antennas are properly tightened Also check that there is a good contact between them 4 With the system running find the fibre optic cable from the transmitter disconnect it at the DVL and look for a red light coming from the top hole in the Fibre Optic Converters Section 2 1 5 Plug this cable back in and unplug the Input black cable at the transmitter Check for a red light coming from the...

Page 211: ...e defective electronic components 12 8 Creating a Test Line for Data Quality After receiving the system and getting comfortable with its operation one of the best ways to detect any future problems is to collect a line of data at a convenient easily accessible location The line does not have to be too long but one screen is a good guide This data line should be saved electronically and perhaps plo...

Page 212: ...00 Manufacturer s Address Sensors Software Inc 1040 Stacey Court Mississauga Ontario Canada L4W 2X8 Tel 905 624 8909 Toll Free 1 800 267 6013 Fax 905 624 9365 Email customerservice sensoft ca Website http www sensoft ca ...

Page 213: ...nterior of the transmitter and receiver can become very hot very quickly if exposed to strong direct sunlight High temperatures can affect system electronics and may lead to failures If a suspected heat failure does occur stop the system and allow it to cool down before retrying 13 2 Cable Care The cable connectors fibre optic converters the transmitter the receiver transducers and the DVL need to...

Page 214: ...bles can stand a great deal of abrasive wear but the user should avoid sharp bends in the cable pulling the cable at right angles close to the fibre optics connectors or allowing the unprotected ends to get dirty or scratched Erratic Time Zero jumps usually indicate a cracked cable If problems are encountered with the fibre optics cables repair is very straightforward and is outlined in detail bel...

Page 215: ... provided in Appendix A Excerpts from the HP Fibre Optic Handbook The polishing kit consisting of polishing fixture 600 grit abrasive paper and 3 micron pink lapping film No adhesive material is needed to secure the cable and the connector can be used immediately after polishing Connectors may be easily installed on the cable end with readily available tools Materials needed for the procedure are ...

Page 216: ...e blue fibre optic connector will correspond with the black strain relief jacket and the grey fibre optic connector with the grey strain relief jacket Step 3 Place the crimp ring and the connector over the end of the cable the fibre should protrude about 0 12 inch 3 mm through the end of the connector Carefully position the ring so that it is entirely on the connector and then crimp the ring in pl...

Page 217: ...rotruding from the bottom of the fixture NOTE The four dots on the bottom of the fixture are wear indicators Replace the fixture when the dots are no longer visible Place the 600 grit abrasive paper on a flat smooth surface Pressing down on the connector polish the fibre and the connector until the connector is flush with the end of the polishing fixture Wipe the connector and the fixture with a c...

Page 218: ...e considered damaged and discarded Do not assume that a battery that is still charging after 8 hours is nearing the end of its charge cycle Typical charging time for an empty battery is 12 hours from start of fast charge When charging a depleted battery it is normal for the charge light to go out after 6 8 hours The charger has gone into trickle mode only and the battery must remain in the charger...

Page 219: ...The low frequency pulseEKKO system comes with spare parts for repairing latches keepers hinges sockets and fuses on the transmitter and receiver replacing pins on the antennas and quarter turn studs on the adjustable handles The positions of most of the items pictured in Figure 13 4 are shown as assembled in Figure 13 5 Use item number 100 54 0097 when ordering the electronic spares Figure 13 4 El...

Page 220: ... is also useful 13 5 Storage Cases Equipment that is transported and stored loosely is more susceptible to damage All equipment should be stored in its shipping case or a storage box Sensors Software has optional shipping cases available for some components and systems 13 6 Upgrading Embedded Software on DVL From time to time Sensors Software release new software for the DVL The instructions below...

Page 221: ...Care Maintenance 209 ...

Page 222: ...Care Maintenance 210 ...

Page 223: ...mitter Receiver Specification Transmitter Receiver PRO Receiver Ultra Operating Temperature 40o C to 60o C 400 F to 1400 F 40o C to 60o C 400 F to 1400 F 40o C to 60o C 400 F to 1400 F Weight 2 8 kg 6 2 lbs 2 8 kg 6 2 lbs 3 4 kg 7 5 lbs Size 260 x 150 x 110 mm 10 2 x 5 9 x 4 3 inches 260 x 150 x 110 mm 10 2 x 5 9 x 4 3 inches 260 x 207 x 110 mm 10 2 x 8 1 x 4 3 inches Power Consumption 150 mA 12V ...

Page 224: ...0 Stacking 2048 65 536 for Ultra Receiver Sampling Digital Equivalent Time Sampling DETS Data quality assurance Active temperature and voltage compensation Pulse Repetition Frequency PRF Variable up to 100 kHz Temporal Sampling Increment hardware 5 ps 14 4 Battery Specifications Transmitter and Receiver Batteries for 12 5 25 50 100 200 MHz Antennas 12 Volts 2 3 AH 0 8 kg 1 8 lb 182 x 24 x 62 mm 7 ...

Page 225: ...s Integrated modules Wi Fi IEEE 802 11 b g n Integrated GNSS Global Navigation Satellite System Receives GPS GLONASS signal 10m Audio Built in speaker 85dBA speaker w volume control Storage 8 GB Internal CPU Speed Quad Core 800 MHz Ports USB RS232 2 x 15 pin GPR ports Odometer Power Temperature Environmental Ruggedized environmentally sealed unit and connections Ingress protection IP rating IP65 u...

Page 226: ...Technical Specifications 214 ...

Page 227: ...Appendix A 215 Appendix A Excerpts from the HP Fibre Optic Handbook The following diagram displays an in line splice t for HFBR 35XX 36XX fibre optic cable with HFBR 4501 4511 simplex connectors ...

Page 228: ...Appendix A 216 ...

Page 229: ...uency component of the radar signal does not propagate but diffuses into the ground In other words the lower end of the spectrum sees an inductive eddy current type response as opposed to a propagating displacement current type response The result is that the large transmit pulse emitted by the radar can be followed by a slowly decaying transient The following diagram shows the effect of inductive...

Page 230: ...the response was often caused by system response characteristics rather than being a ground induced response Dewow Filter Since wow usually present in GPR data it is a best practice to high pass DEWOW filter GPR data DEWOW is a high pass filter optimized to pass the transmitted signal spectral peak for the specific antenna center frequency with fidelity and suppress the low frequency wow in the da...

Page 231: ...uations unaware of this wow or low frequency component in the data The raw recorded data however always retained this information The following diagram displays a single data trace where Wow has been removed with the Dewow high pass filter The following image displays a data section where Wow has been removed with the Dewow high pass filter Pulse Precursor The result of high pass filtering can ind...

Page 232: ...nal pulse This gives rise to a pre cursor in the data before Time Zero when looking at the plotted sections Clipping The second artifact is caused by electronic clipping The basic concept is depicted in the following diagrams The original signal acquired by the antenna and then sent to the receiver electronics is similar to diagram a above ...

Page 233: ...at least one meter a 50 MHz antenna system should use an antenna spacing of two meters This rule depends on the level of wow or inductive response present at the particular site Processing affects only displayed data not recorded data Other Types of Filters For dealing with the inductive wow response high pass filtering is necessary If an alternative high pass filter is available or you want to tr...

Page 234: ...Appendix B 222 ...

Page 235: ... sensoft ca contains a wealth of information case studies and support Click here to visit the FAQ Frequently Asked Questions page on our website to learn more topics such as 1 Basic GPR Theory 2 How deep can GPR see 3 What creates GPR Reflections 4 How do I select a GPR frequency 5 How can velocity be extracted from hyperbolas Click here to see a Glossary of GPR terms and mathematical symbols ...

Page 236: ...Appendix C 224 ...

Page 237: ...time duration specified by the FCC and OSHA vary with excitation frequency The lowest threshold plane wave equivalent power cited is 0 2 mW cm2 for the general population over the 30 to 300 MHz frequency band All other applications and frequencies have higher tolerances as shown in graphically in Figure B 1 Figure B 0 1 FCC limits for maximum permissible exposure MPE plane wave equivalent power de...

Page 238: ...Appendix D 226 ...

Page 239: ...received including interference that may cause undesired operation Part 15 User Information This equipment has been tested and found to comply with the limits for a Class A digital device where applicable and for an ultra wide bandwidth UWB device where applicable pursuant to Part 15 of the FCC Rules These limits are designed to provide reasonable protection against harmful interference when the e...

Page 240: ...te company investigating forensic evidence for a local police department FCC Permitted Mode of Usage The GPR antenna must be kept on the surface to be in compliance with FCC regulations Use of the antenna is not permitted if it is lifted off the surface Use as a through the wall imaging device is prohibited GPR Use Coordination FCC regulation 15 525 c updated in February 2007 requires users of GPR...

Page 241: ...e designated areas once the information requested on the UWB imaging system is submitted to the FCC no additional coordination with the FCC is required provided the reported areas of operation do not change If the area of operation changes updated information shall be submitted to the FCC following the procedure in paragraph b of this section f The coordination of routine UWB operations shall not ...

Page 242: ...E NUMBER AREA OF OPERATION COUNTIES STATES OR LARGER AREAS FCC ID QJQ NG250 EQUIPMENT NOMENCLATURE NG250 Send the information to Frequency Coordination Branch OET Federal Communications Commission 445 12th Street SW Washington D C 20554 ATTN UWB Coordination Fax 202 418 1944 INFORMATION PROVIDED IS DEEMED CONFIDENTIAL ...

Page 243: ...acquire copies of the following documents available from ETSI ETSI EN 302 066 1 V1 2 1 February 2008 Electromagnetic compatibility and Radio spectrum Matters ERM Ground and Wall Probing Radar applications GPR WPR imaging systems Part 1 Technical characteristics and test methods ETSI EN 302 066 2 V1 2 1 February 2008 Electromagnetic compatibility and Radio spectrum Matters ERM Ground and Wall Probi...

Page 244: ...d emergency rescue or firefighting organizations Should the ground penetrating radar be used in a wall penetrating mode then the following restriction should be noted by the user This In wall Radar Imaging Device shall be operated where the device is directed at the wall and in contact with or within 20 cm of the wall surface This In wall Radar Imaging Device shall be operated only by law enforcem...

Page 245: ...utte contre les incendies Si le géoradar est utilisé dans un mode de pénétration au mur la restriction suivante est à noter par l utilisateur Ce dispositif d imagerie radar doit être utilisé lorsque l appareil est orienté vers le mur et en contact avec ou dans les 20 cm de la surface du mur Ce dispositif d imagerie radar doit être utilisé que par les organisations d application de la loi les insti...

Page 246: ...Appendix E 234 ...

Page 247: ...ic fields such as TV stations radio stations and cell phones can cause signals detectable by a GPR which may degrade the quality of the data that a GPR device records and displays Such interference is unavoidable but sensible survey practice and operation by an experienced GPR practitioner can minimize such problems In some geographic areas emissions from external sources may be so large as to pre...

Page 248: ...Appendix F 236 ...

Page 249: ...g the GPR transmitters at least 5 feet 2m from blasting cap leads as a precaution Some customers do experimental trials with their particular blasting devices to confirm with safety We strongly recommend that GPR users routinely working with explosive devices develop a systematic safety methodology in their work areas The UXO issue is more complex and standards on fuses do not exist for obvious re...

Page 250: ...Appendix G 238 ...

Page 251: ...nd if not installed and used in accordance with the instruction manual may cause harmful interference to radio communications Operation of this equipment in a residential area is likely to cause harmful interference in which case the user will be required to correct the interference at his her own expense Industry Canada Notice This device complies with Industry Canada s license exempt RSSs Operat...

Reviews: