

5 – Managing Ports
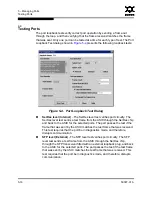
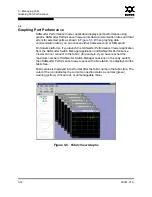
Graphing Port Performance
5-26
59097-01 A
0
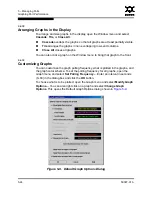
5.6.7.4
Setting Global Graph Type
The Set Global Graph Type option enables you to view port activity using two
types of graphs:
Line Graph - plots continuous port activity in horizontal line format.
Bar Graph - the last polling value received by the application in bar graph
format.
To set the global graph type, open the Graph menu and select
Line Bar
or
Bar
Graph
.
5.6.7.5
Rescaling a Selected Graph
The Rescale Selected Graph option auto-scales downward and re-positions the
data within a graphic window to display all new data captured by the graph. To
rescale a selected graph, do the following:
1.
Select a displayed graph.
2.
Open the Graph menu and select
Rescale Selected Graph
, or right-click on
the graph and select
Rescale
from the popup menu.
3.
View the data in the graph window.
5.6.8
Printing Graphs
To print a graph, select a graph, then open the File menu and select
Print Graph
Window
. You can also right click on a graph and select
Print Graph Window
from the popup menu.
5.6.9
Saving Graph Statistics to a File
Statistics for one or all graphs can be saved to a file that can be opened with a
spreadsheet application. To save a graph statistics file, do the following:
1.
Select a graph.
2.
Open the File menu, and select
Save Current Graph Statistics to a File
to
save the selected graph or select
Save All Graph Statistics to a File
. You
can also right click on a graph and select
Save Statistics to File
.
3.
In the Save dialog, enter a path name for the file. By default, the file is saved
in the working directory.
4.
Click the
Save
button.