optris PI – E2010-03-A
50
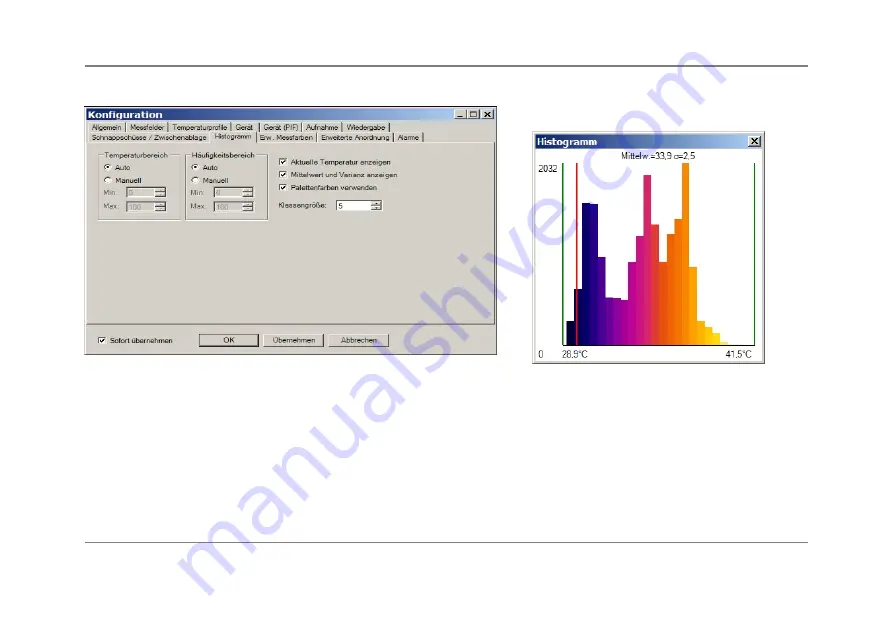
Configuration: Histogram
Histogram
Temperature range /Quantity range:
The given temperature range and frequency range can be generated by the software or by the user by defining
the minimum/maximum temperature value respectively minimum/maximum frequency
Display current tem:
If activated
red
line showing the current temperatur will appear in the graph.
Display mean and sigma value:
Average temperature and variance (statistical dispersion) can be displayed
Class size:
number of values measured which should be affiliated to one class.


