


36
Adjust Exponential
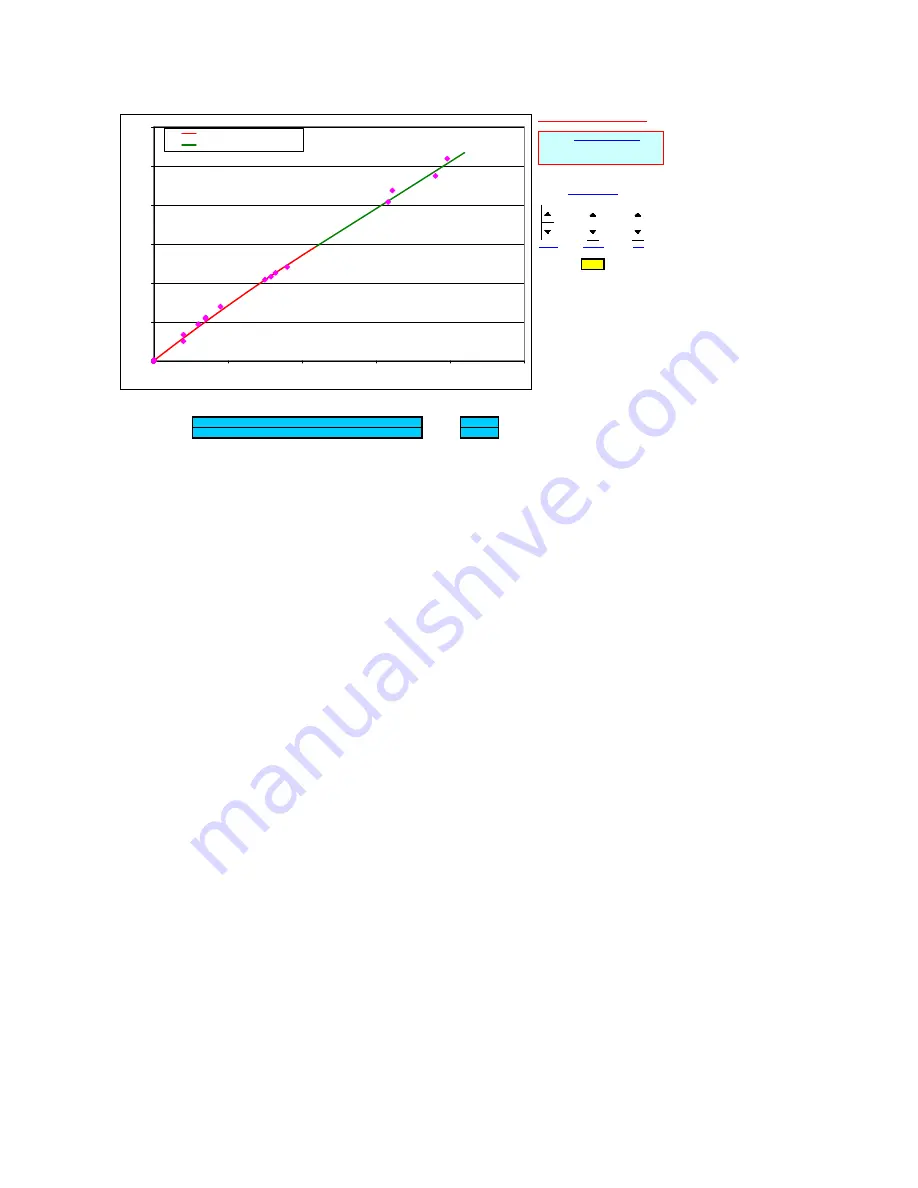
Use the Coarse, Medium, and Fine scroll buttons to match the slope of the exponential red curve and the
associated data points at the smoothest range of surface values. Lasercheck measurements and actual
surface roughness eventually exhibit an exponential relationship as the surface values get very smooth (a
few microinches and below).
Step 5 Review
Below is an image of the Step 5 tab of the spreadsheet including instructions. This final graph allows you to
review the curve fitting of all regions of roughness that have been performed in Step 2 through Step 4. If
any regions of the best fit curves do not appear to “best-fit” the data, then go back to the relevant tabs and
step back through the process until “best possible fit” is obtained for all ranges of roughness.
INSTRUCTIONS FOR THIS PAGE
Adjust Exponential
Coarse
Medium
Fine
-0.50
1.10
Break Point
SMOOTH_CAL1
y =
-0.50
x^2 +
5.90
x +
0.00
1.10
SMOOTH_CAL2
y =
0.00
x^2 +
4.80
x +
0.60
5.10
Lasercheck Calibration Curve
0.0
2.0
4.0
6.0
8.0
10.0
12.0
0.0
0.5
1.0
1.5
2.0
2.5
Uncalibrated Lasercheck Measurements
A
ct
ua
l R
ou
gh
ne
ss
V
al
ue
s
y = -0.50 x^2 + 5.90 x + 0.00
y = 0.00 x^2 + 4.80 x + 0.60
1. Use the
Adjust Exponential
controls to best fit the
red
curve to the
smooth range of data points.


