


34
Filename =
Manually enter a filename here. This will be carried through the spreadsheet and used in naming the setup
file when transferred into the controller. Try to use a name that is descriptive of either the process or the job
and parts that it is to be used on.
Control =
Use the drop down dialog box to select how measurements will be performed. Options are:
•
MEAS
Controlled by front panel pushbutton (Only option available with this system)
•
SERIAL
Controlled by external software (Not available with this instrument)
•
EXTERNAL_1
Controlled by external trigger (Not available with this instrument)
Units =
Use the drop down dialog box to select measurement units to be displayed. Options are:
•
MICROINCHES
•
MICRONS
•
NANOMETERS
Cal Type =
Use the drop down dialog box to select “curve fitting mathematics” to be used for creating calibration
values. Options are:
•
EXPONENTIAL
Linear and exponential equations (Only option available with this system)
•
POWER
Power based equations (Not available with this instrument)
Step 2 Mid Range
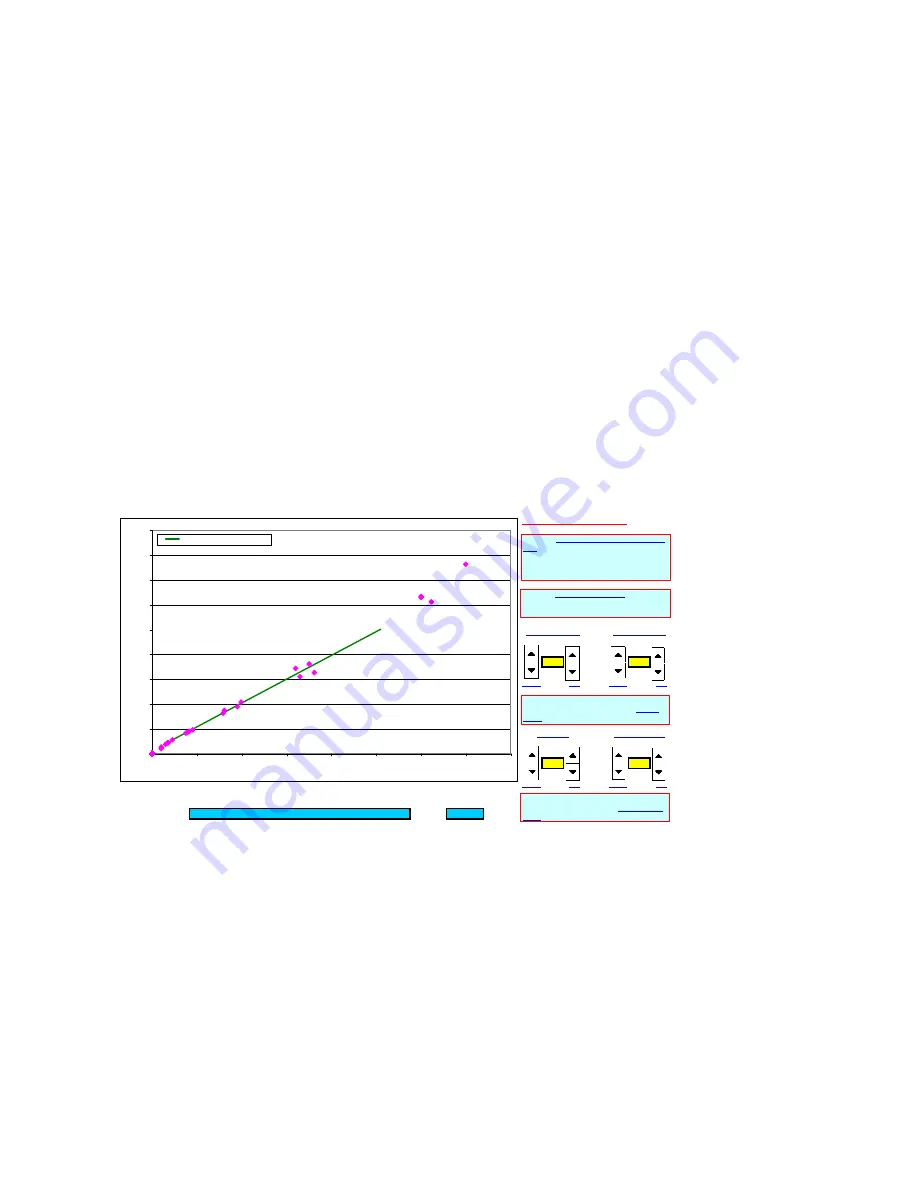
Below is an image of the Step 2 tab of the spreadsheet including instructions.
Adjust Max “X Value” / Adjust Min “X Value”
Use the scroll buttons to extend or contract the linear green curve and the associated data points that the
linear curve will be best fit to. Linear fits will be found on most sets of Lasercheck and stylus values and
INSTRUCTIONS FOR THIS PAGE
Adjust Max "X Value"
Adjust Min "X Value"
5.10
0.40
Coarse
Fine
Coarse
Fine
Adjust Slope
Raise / Lower Curve
4.80
0.60
Coarse
Fine
Coarse
Fine
Break Point
SMOOTH_CAL2
y =
0.00
x^2 +
4.80
x +
0.60
5.10
Lasercheck Calibration Curve
0.0
5.0
10.0
15.0
20.0
25.0
30.0
35.0
40.0
45.0
0.0
1.0
2.0
3.0
4.0
5.0
6.0
7.0
8.0
Uncalibrated Lasercheck Measurements
A
ct
ua
l R
ou
gh
ne
ss
V
al
ue
s
y = 0.00 x^2 + 4.80 x + 0.60
1. Use the
Adjust Max "X Value" Coarse and
Fine
controls to select the number of data
points in the graph. Look for a "LINEAR" set of
points in the data (typically mid range
roughness).
3. Adjust the Slope of the
green curve
to match
the linear data points slope using the
Adjust
Slope
controls.
4. Raise and Lower the
green curve
to match
the linear data points using the
Raise / Lower
Curve
controls.
2. Use the
Max and Min "X Value
controls to
match the range of the
green curves
X Values
to the "LINEAR" points.


