- 35 -
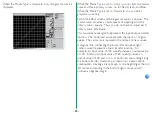
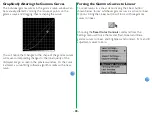
When the Media Type is ‘Grayscale’, only one gamma curve is
displayed.
When the Media Type is set to ‘Color’, you can edit one master
curve and three primary curves, i.e., for Red, Green, and Blue.
When the Media Type is set to ‘Grayscale’, you can edit a
grayscale curve only.
Each of the Red, Green and Blue gamma curves is unique. The
master curve provides a simple means of adjusting all of the
primary curves equally. Thus, you do not have to adjust each
primary curve individually.
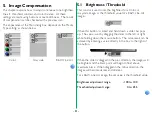
This two-dimensional graph represents the input/output transfer
function. The horizontal axis represents the input, or original
values. The vertical axis represents the output, or new values.
A diagonal line connecting the lower-left and upper-right
corners would represent a linear transfer function. For
example, an input value of 100 would produce an output value
of 100. Similarly, an input value of 200 would produce an
output value of 200, and so on. A horizontal line running along
the bottom border would map all inputs into a zero output,
consequently creating a black image. A line beginning at the top
left corner, and ending in the bottom right corner, would
produce a negative image.

