9 LTOS7 Management and Monitoring
9.1.8.2 Sync Monitor first steps
When starting SyncMon the first time no monitoring is activated. To activate monitoring at least one node has
to be added. Press the button
"Add Member"
to add a new monitoring node.
9.1.8.3 Sync Monitor Status and Configuration via WEB Interface
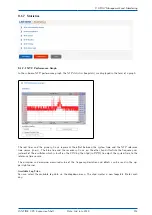
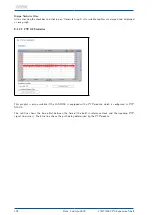
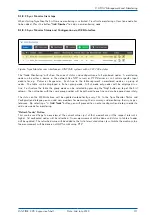
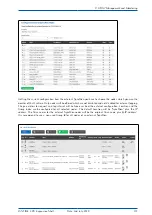
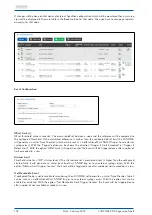
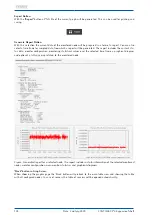
Figure: Sync Monitor user interface on LANTIME systems with a FW 7.00 or later.
The "Node Monitoring" will show the current status and configuration of all monitored nodes. A monitoring
node can be either a device in the network like NTP servers or PTP devices or an Lantime specific input
module for e.g. Pulses or frequencies. Each line in the table represent a monitored node or a group of
nodes. The table can be displayed in flat or group mode. In flat mode only nodes will be displayed in a
line. To structure the table the group mode can be selected by pressing the
"Grp"
button on top of the first
column – then all nodes with the same group number will be gathered to one line and can be opened separately.
The status on the WEB interface will be updated automatically every 10s. In the Sync Monitor Status and
Configuration dialogue you can add new members for measuring their accuracy and monitoring their sync per-
formance. By selecting a
"+ Add Node"
button you will proceed to an enter configuration dialog in order to
add a new node for monitoring.
"Refresh Nodes" Button:
This can be used to get an overview of the current values just at that moment even if the request interval is
higher. All configured nodes will be refreshed. A new measurement will be done and status in table of nodes
will be updated. The refreshed value will be added to the list of measured values to calculate the median value.
No measurement will be done on all HPS cards using PTP.
LANTIME CPU Expansion Shelf
Date: 2nd July 2020
111
Summary of Contents for LCES
Page 2: ......


