
51
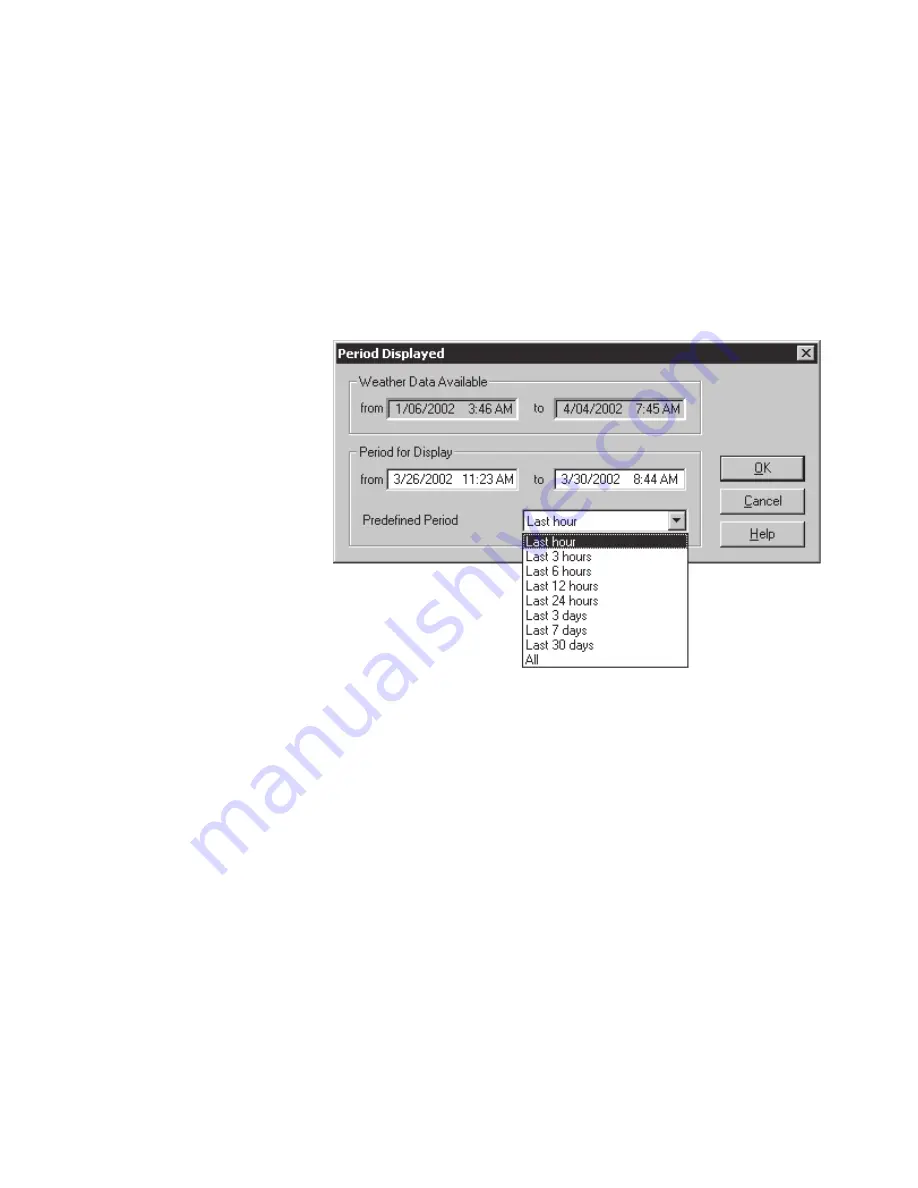
Period
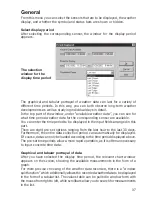
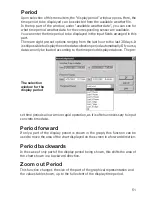
Upon selection of this menu item, the “display period” window opens. Here, the
time period to be displayed can be selected from the available weather file.
In the top part of the window, under “available weather data”, you can see for
what time period weather data for the corresponding sensor are available.
You can enter the time period to be displayed in the input fields arranged in this
part.
There are eight pre-set options ranging from the last hour to the last 30 days. It
is still possible to display the entire data collection period automatically. Of course,
data can only be loaded according to the time period displayed above. The pre-
set time periods allow a more rapid operation, as it is often unnecessary to input
concrete time data.
Period forward
If only a part of the display period is shown in the graph, this function can be
used to move the area of the chart displayed on the screen in a forward direction.
Period backwards
In the case of only part of the display period being shown, this shifts the area of
the chart shown in a backward direction.
Zoom out Period
This function changes the size of the part of the graphical representation and
the values table shown, up to the full extent of the display time period.
The selection
window for the
display period
Summary of Contents for WS-2510
Page 3: ...3 ...
Page 9: ...9 Chapter 1 Introduction ...
Page 16: ...16 ...
Page 17: ...17 Chapter 2 Starting operation ...
Page 28: ...28 Chapter 3 File menu ...
Page 36: ...36 Chapter 4 Display menu ...
Page 42: ...42 Chapter 5 Weather display menu ...
Page 44: ...44 Chapter 6 Interface menu ...
Page 49: ...49 ...
Page 50: ...50 Chapter 7 View menu ...
Page 75: ...75 ...