Chapter
11: Qualification Reports
Kaye ValProbe RT User Manual
107
Edit Sensors
Press
Edit Sensors
to choose the sensors to include in each Graph Report. Selections
made on the Graph Report screen are unique to the Graph Report and do not affect the
contents of the Setup, Qualification Detailed, or Qualification Summary Reports.
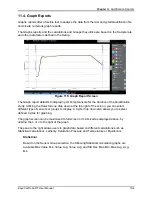
Options for choosing sensor colors and line thickness are available.
Important: Excluded sensors from any of the graph reports are not included in the
calculation graphs. To include sensors in calculation graphs excluded
previously for another graph view, select it again before switching the next
calculation graphs.
Edit Limit Labels
The Edit Limit Labels screen displays upper and lower limits on the graph. Available
sensor types depend on the sensor type for the graph.
To add limit lines to a graph, enter an upper and/or lower limit value or Avg (s) and
label. These display as horizontal lines at the selected measurement points. You can
also select the line color, thickness and line style.
When you have finished, press
Apply
on the Edit Limit Labels screen.
Generate Report
Press Generate Report to create a pdf report of the graph. Enter a custom label and
select Apply. As many graphs as are necessary to properly evaluate your qualification
study can be generated. An option in the Summary Report allows the graph of the
complete study to automatically be included in your Summary report.
Summary of Contents for ValProbe RT
Page 1: ...Validation Kaye ValProbe RT User Manual MXXX EN Rev 1 0 May 2020 ...
Page 2: ... No content intended for this page ...
Page 4: ... No content intended for this page ...
Page 12: ......
Page 163: ...Kaye ValProbe RT User Manual 150 ...
Page 166: ... No content intended for this page ...

