


36
4.2 [M ethod] m enu
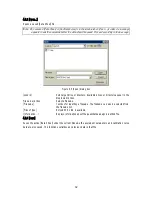
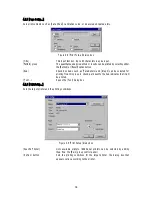
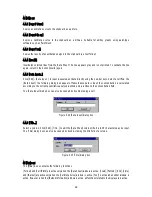
4.2.1 [N ew ...]
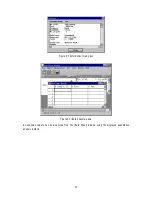
C reates a new calibration curve. C lick [N ew ...] to open the follow ing dialog box.
N ote: If a calibration curve has not been saved, a m essage appears to ask the operator w hether to save it.
P roceed according to the m essage.
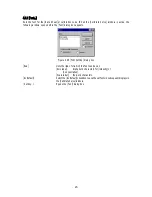
F igure 4.11 [Q uantitative M easurem ent - P aram eters] dialog box
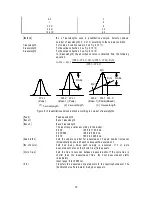
[R esponse]
R esponse by sim ple m oving average.
Q uick:
M oving average during about 0.03 sec
Fast:
M oving average during about 0.25 sec
M edium :
M oving average during about 1 sec
S low :
M oving average during about 4 sec
[B and w idth]
S pectral bandw idth. S electable range varies according to the m odel.
V -530:
F ixed at 2 nm
V -550/560: 0.1, 0.2, 0.5, 1, 2, 5, 10 nm
V -570:
0.1, 0.2, 0.5, 1, 2, 5, 10 nm
0.4, 0.8, 2, 4, 8, 20, 40 nm (near infrared
region)
N ote: W hen using the V -570 for m easurem ent from the near-infrared region to the visible region in succession,
the bandw idths listed in Table 4.1 should be paired. If the bandw idth is set to the sam e (nearly equal)
value, noise in the near-infrared region m easurem ent value w ill increase.
N ote: In the Table below , L after the bandw idth m eans low stray light m ode. In this m ode, the slit is m asked
at the top and bottom to im prove the purity of light by cutting off unnecessary light.
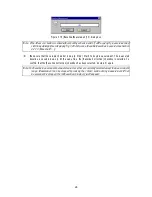
T able 4.1
U ltraviolet (U V ) / visible region bandw idth (nm )
N ear-infrared (N IR ) bandw idth (nm )
0.1
0.4
0.2
0.8


