


10
3. Quantitative Analysis and Spectrum Measurement
T his section describes quantitative analysis and spectrum m easurem ent. T he param eters are described
only briefly in order to clarify the operation flow . F ollow the procedures outlined below in order to becom e
fam iliar w ith the operation of V -500W . F or m ore detailed inform ation, see the section for each program .
3.1 Q uantitative Analysis Introduction
T he follow ing sections briefly describe the quantitative analysis program and its operation flow , follow ed by
the procedure for creating calibration curves, unknow n sam ple m easurem ent, and saving and printing
results.
3.1.1 Q uantitative analysis program overview
3.1.1.1 Quantitative analysis program
T he quantitative analysis program has the follow ing features.
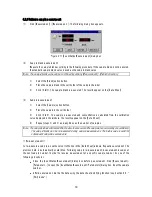
(1)
T hree m ethods of analysis outlined.
1)
1-w avelength quantitative analysis. F ig. 3.1 (1).
U sed for norm al solution sam ple.
2)
2-w avelength quantitative analysis. F ig. 3.1 (2).
U sed for baseline correction.
3)
3-w avelength quantitative analysis. F ig. 3.1 (3).
U sed for baseline correction.
T he follow ing form ula is used for 3-w avelength quantitative analysis. W L1 is the w avelength and E
(1) the absorbance at that w avelength.
D
Abs
E
WL
WL
E
WL
WL
E
WL
WL
=
-
-
×
+
-
×
-
( )
|
| ( ) |
| ( )
|
|
1
1
2
3
3
1
2
3
2
WL 1
WL 1
WL 2
D Abs
D Abs
WL 1
WL 2
WL 3
E(2)
E(1)
E(3)
(1)
(2)
(3)
1-wavelength
2-wavelength
3-wavelength
(Peak)
(Base 1) (Peak)
(Peak)
(Base 1)
(Base2)
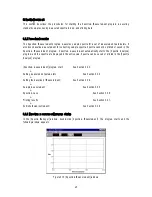
F igure 3.1 Q uantitative analysis m ethods
(2)
T he calibration curve can be selected from the m odes show n below , according to the application.


