


28
4. [Quantitative Analysis]
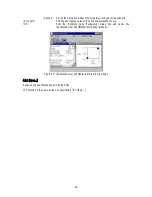
D ouble-click [Q uantitative A nalysis] in the [S pectra M anager] w indow . T he program starts and the follow ing
w indow appears after spectrophotom eter initialization.
Calibration Curve
Data Sheet
Method's Information
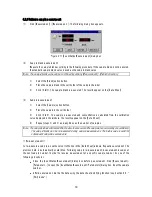
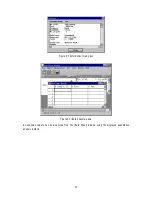
F igure 4.1 [Q uantitative A nalysis] w indow
[Q uantitative A nalysis] w indow
T he [Q uantitative A nalysis] program display contains the follow ing three w indow s (see F ig. 4.1). T hese
three w indow s m ay be opened sim ultaneously. H ow ever, no m ore than one of the sam e w indow m ay be
opened at the sam e tim e.
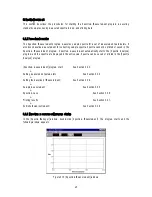
[Calibration Curve]
Displays a calibration curve. Always appears when the [Method
Information] window is opened.
[Data Sheet]
Measurement of unknown sample is done when this window is
open. [Calibration Curve] and [Method Information] windows
must be opened in order to display this window.
[Method Information]
Displays information including measurement parameters,
calibration curve data, and comments. Always appears when the
[Calibration Curve] window is opened.
m enu
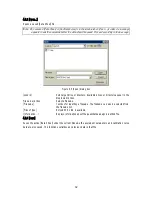
[F ile] m enu
[N ew ...]
O pens a new [D ata S heet] display.
[O pen...]
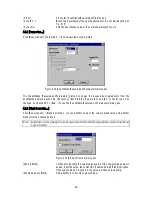
O pens a saved [D ata S heet] file.
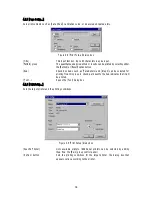
[S ave]
S aves the active [D ata S heet] under the current filenam e. M easurem ent
param eters and calibration curve data are also saved at that tim e.
[S ave A s...]
S aves the active [D ata S heet] under a new filenam e. M easurem ent
param eters and calibration curve data are also saved at that tim e.
[P age S etup...]
S ets print contents such as [D ata S heet], calibration curve, or
m easurem ent param eters.
[P rint S etup...]
S ets the target printer and the printing conditions.
[P rint...]
P rints the data from the active w indow set by [P age S etup...].
[E xit]
E xits the quantitative analysis program and returns to the [S pectra


