


7-8 Waterfalls, Order Tracking, and Slice Views
878193
eZ-Analyst
Selecting Display Options
Most single-display spectrum function views (FV) offer access to toolbar buttons for selecting optional spectral
displays. To access available spectral view options:
1.
Open the desired spectral function view.
2.
Select a Spectrum Display mode.
3.
Click the applicable toolbar button(s).
Note
: If the buttons are disabled, then the function view does not support the optional spectral view
feature. For example: Time, Octave, and Windowed function views do not support the features.
A review of the related toolbar buttons follows. Note that the display examples and the status of the 4 associated
buttons, which were discussed in Chapter 5, are being repeated in this chapter for convenience.
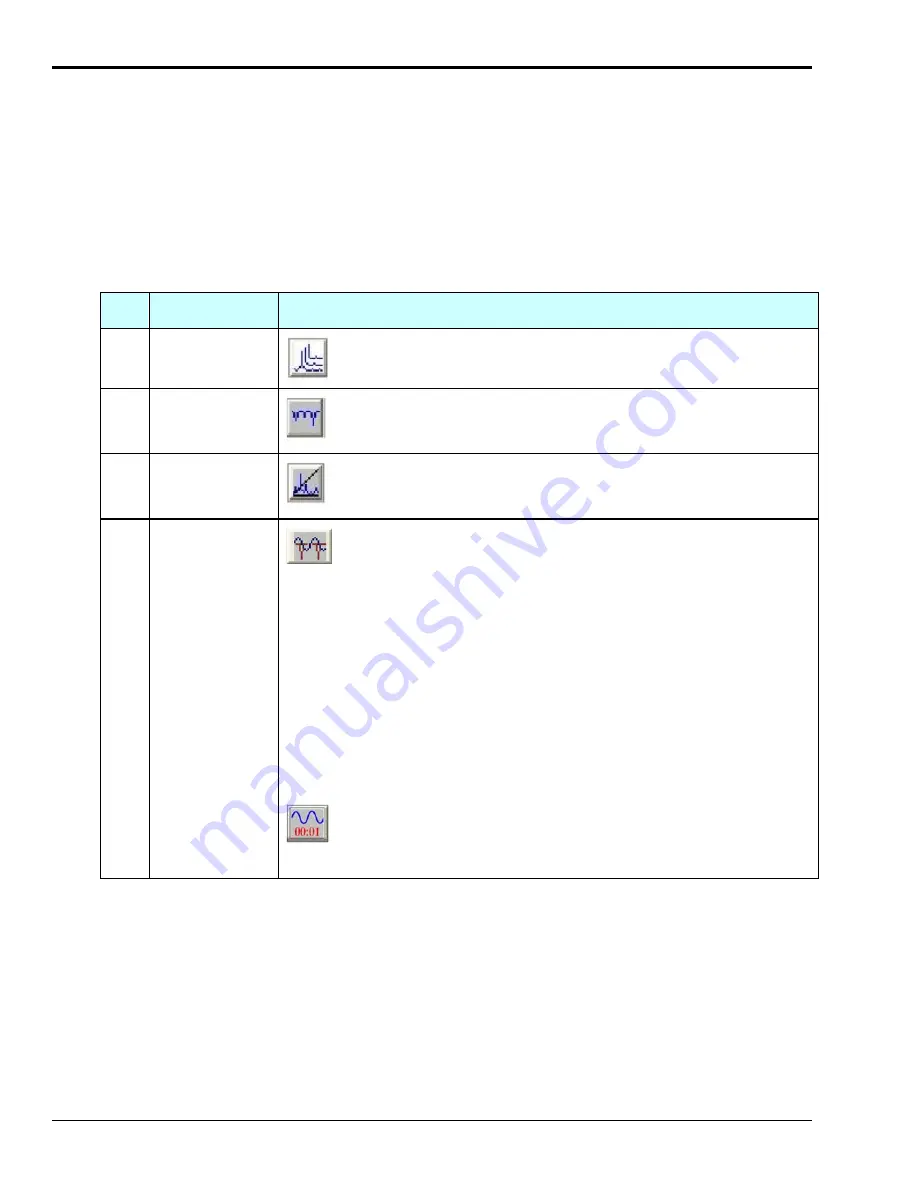
Function
Description / Comments
31 3D
Waterfall
View
Used to bring up a 3D Waterfall display.
32 Frequency
or
Orders
Slice View
Brings up a display for a chosen frequency. This is a “slice” of the
waterfall or order tracking, taken at a given frequency (or order).
33 Spectrum
Display Split
View
Brings up a standard spectrum display plus allows for a second
display, for example: a 3D Waterfall display or a Frequency Slice.
34 Order
Tracking
or Frequency
View
Order
Tracking
This button is used to enable the Order Tracking display mode or
the Frequency View mode.
The
Order Tracking
display mode provides a means of displaying
data from points which are evenly spaced by RPM, instead of
increments of time. On the x-axis scale of the Order Tracking
display: 1 equals shaft RPM, 2 equals 2 x Shaft RPM, 3 equals
3 x Shaft RPM, etc.
Order Tracking
presents data in the frequency domain. To use
Order Tracking
a tachometer must be assigned to an enabled
channel.
Note that if the <Order Tracking> and <Slice View> buttons are
both enabled, eZ-Analyst displays the slice view above the order
tracking view. The
Order Tracking
display can be enabled from
either the Measurement (Real Time) mode or the Playback mode.
Frequency
View
The Frequency View mode is the standard eZ-Analyst spectrum
view. When this view is enabled the button appears as shown to
the immediate left.
Note
: Buttons 31, 32, and 33 are enabled for most single-display spectral function views (FV). They are
never enabled for time function views as the x-axis must be in frequency. Any two of these three
functions can be displayed at the same time. See table on followig page in regared to button
combinations and resulting displays.
In regard to button # 34, to enable
Order Tracking
click the button after verifying the following:
o
at least one tachometer is assigned to a channel
o
the tach channel is enabled
o
no dual-function window is open, e.g., no FRF.


