


6-2 Interactive Plot Display
988191
eZ-Analyst
Using Cursors
In eZ-Analyst cursors can appear as vertical lines that indicate an X Y axis intersect via an
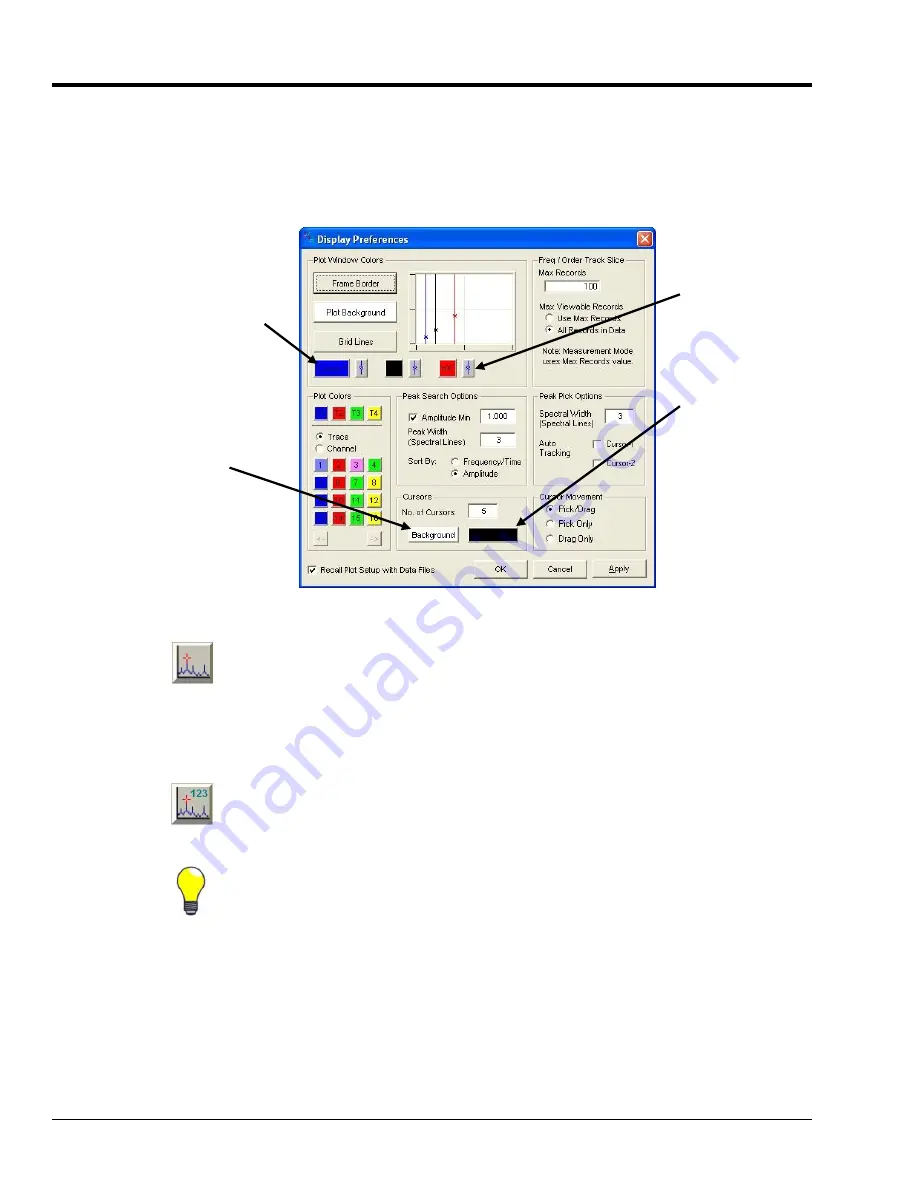
asterisk (*), or can appear as an asterisk alone. Line and Point settings are made from the
Display Preferences window (following figure) which is accessed from the Edit Pull-down
menu. The window also allows you to change settings for cursor colors, the number of
cursors to be used in Peak and FreeForm modes, and select the desired type of cursor
movement.
Display Preferences Window, Areas Affecting Cursors
The graph toolbar, discussed in chapter 5, includes a button, which permits the user
to cycle through cursors by function. Each click of the button cycles to another type
of cursor function: No cursor, Single, Dual (Band), SideBand, Peak, and FreeForm.
Note
: Another method of choosing a cursor, as opposed to using the cursor button,
is to right-click on the plot region and select “cursor” from the resulting pop-
up window.
The toolbar includes an annotation button which is similar in appearance to the
cursor button. The annotation button cycles through the following: No annotation,
frameless annotation, and framed annotation.
Tip
: If annotations or cursors are not visible, check the color settings in the Display
Preferences window to ensure that you are not making use of, for example, a white
foreground on a white background.
Cursor-1, 2, and
nX boxes are
used to set cursor
colors.
Sets the
Annotation
frame color.
The “Line / Point” toggle
buttons are use to set the
cursor’s appearance to a full
line with an X Y intersect point,
or to a single intersect point.
Sets the Annotation text color.
If you do not see the
annotation, check the color
setting, it is likely the same as
your background or frame color.


