


158
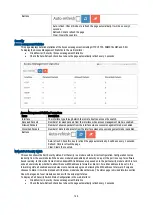
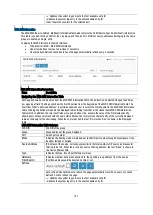
RMON Statistics Status Overview Parameters:
Items
Description
ID
Indicates the index of Statistics entry.
Data Source (if Index)
The port ID which wants to be monitored.
Drop
The total number of events in which packets were dropped by the probe due teo lack of
resources.
Octets
The total number of octets of data (including those in bad packets) received on the network.
Pkts
The total number of packets (including bad packets, broadcast packets, and multicast
packets) received.
Broad-cast
The total number of good packets received that were directed to the broadcast address.
Multi-cast
The total number of good packets received that were directed to a multicast address.
CRC Errors
The total number of packets received that had a length (excluding framing bits, but including
FCS octets) of between 64 and 1518 octets, inclusive, but had either a bad Frame Check
Sequence (FCS) with an integral number of octets (FCS Error) or a bad FCS with a non-integral
number of octets (Alignment Error).
Under-size
The total number of packets received that were less than 64 octets.
Over-size
The total number of packets received that were longer than 1518 octets.
Frag
The number of frames which size is less than 64 octets received with invalid CRC.
Jabb
The number of frames which size is larger than 64 octets received with invalid CRC.
Coll
The best estimate of the total number of collisions on this Ethernet segment.
64
The total number of packets (including bad packets) received that were 64 octets in length.
65-127
The total number of packets (including bad packets) received that were between 65 and 127
octets in length.
128-255
The total number of packets (including bad packets) received that were between 128 and 255
octets in length.
256-511
The total number of packets (including bad packets) received that were between 256 and 511
octets in length.
512-1023
The total number of packets (including bad packets) received that were between 512 and
1023 octets in length.
1024-1588
The total number of packets (including bad packets) received that were between 1024 and
1588 octets in length.
Buttons
Auto-refresh: Check this box to refresh the page automatically. Automatic refresh occurs
every 3 seconds.
Refresh: Click to refresh the page immediately.
<<: Updates the table starting from the first entry in the Statistics table, i.e. the entry with
the lowest ID.
>: Updates the table, stating with the entry after the last entry currently displayed.
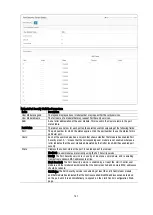
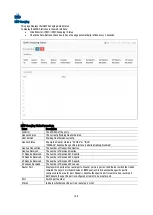
RMON History Overview
This page provides an overview of RMON History entries. Each page shows up to 99 entries from the History table, default
being 20, selected through the "entries per page" input field. When first visited, the web page will show the first 20 entries
from the beginning of the History table. The first displayed will be the one with the lowest History Index and Sample Index
found in the History table. The "Start from History Index and Sample Index" allows the user to select the starting point in
the History table. Clicking the button will update the displayed table starting from that or the next closest History table
match. This will use the last entry of the currently displayed entry as a basis for the next lookup. When the end is reached
the text "No more entries" is shown in the displayed table.
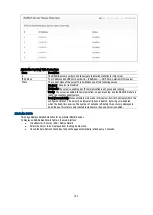
To display the RMON History Configuration in the web interface:
Click Monitor / Security / Switch / RMON / History
Enter a Start from Control Index and the number of entries to be displayed per page.
Check the Auto-Refresh check box to have the page automatically refresh every 3 seconds.


