


When
the
transform
is
complete
the
frequency-domain
data
is
displayed.
11.
A
marker
is
placed
on
the
carrier
at
the
0
Hz
reference
(at
the
left
edge
of
the
display).
T
o
determine
the
frequency
and
amplitude
dierence
from
the
carrier
,
press:
4
MKR
5
NNNNNNNNNNNNNNNNNNNNNNNNNNNNNNNNNNNNNN
MARKER
DELTA
Use
the
knob
to
move
the
marker
to
the
modulation.
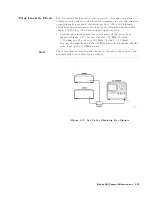
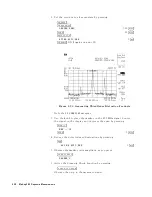
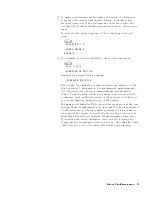
Figure
7-6.
Using
the
FFT
Function
The
results
of
the
FFT
function
are
displayed
on
the
receiver
screen.
The
carrier
is
displayed
at
the
left
edge
of
the
screen.
The
modulation
sidebands
and
any
distortion
is
displayed
along
the
horizontal
axis
.
The
left
edge
of
the
graticule
represents
0
Hz
relative
to
the
carrier
.
The
right
edge
of
the
graticule
represents
the
maximum
FFT
frequency
calculated.
In
Figure
7-6
the
maximum
FFT
frequency
is
200
divided
by
the
sweep
time
(250
Hz).
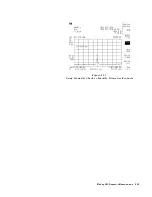
The
amplitude
relationships
between
the
carrier
,
sidebands
,
and
distortion
components
are
the
same
as
they
would
be
if
displayed
using
swept-tuned
operation
in
log
mode
at
10
dB
per
division.
Note
The
annotation
describes
the
settings
before
the
FFT
(linear
mode
,
center
frequency
300
MHz,
span
0
Hz),
and
the
marker
annotation
describes
the
settings
after
the
FFT
(log
mode
,
signal
at
60
Hz,
maximum
frequency
is
250
Hz).
12.
Turn
o
the
markers
by
pressing:
4
MKR
5
NNNNNNNNNNNNNNNNNNNNNNNNNNNNNNNNNNNNNNNNNNNNNNN
MARKER
1
ON
OFF
OFF
Making
Other
Measurements
7-11