


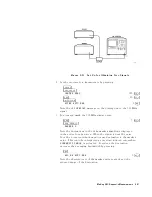
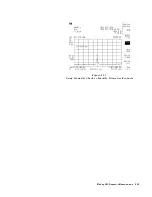
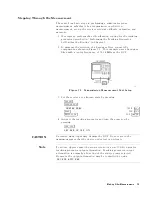


Figure
6-21.
Set-Up
for
Obtaining
Two
Signals
2.
Set
the
receiver
to
a
known
state
by
pressing:
4
PRESET
5
4
FREQUENCY
5
NNNNNNNNNNNNNNNNNNNNNNNNNNNNNNNNNNN
CENTER
FREQ
:
:
:
:
:
:
:
:
:
:
:
:
:
:
:
:
:
:
:
:
:
:
:
:
:
:
:
:
:
:
:
:
:
:
:
:
:
:
:
:
:
:
305
4
MHz
5
4
SP
AN
5
:
:
:
:
:
:
:
:
:
:
:
:
:
:
:
:
:
:
:
:
:
:
:
:
:
:
:
:
:
:
:
:
:
:
:
:
:
:
:
:
:
:
:
:
:
:
:
:
:
:
:
:
:
:
20
4
MHz
5
4
AMPLITUDE
5
NNNNNNNNNNNNNNNNNNNNNNNNNNNNNNNNNNNNNNNNNNNN
ATTEN
AUTO
MAN
:
:
:
:
:
:
:
:
:
:
:
:
:
:
:
:
:
:
:
:
:
:
:
:
:
:
:
:
:
:
:
:
:
:
:
:
:
:
:
:
:
:
0
4
dB
5
Note
the
IF
OVERLOAD
message
on
the
display
due
to
the
300
MHz
signal.
3.
T
o
view
and
mark
the
305
MHz
signal,
press:
4
SP
AN
5
:
:
:
:
:
:
:
:
:
:
:
:
:
:
:
:
:
:
:
:
:
:
:
:
:
:
:
:
:
:
:
:
:
:
:
:
:
:
:
:
:
:
:
:
:
:
:
:
:
:
:
:
:
:
:
5
4
MHz
5
4
PEAK
SEARCH
5
NNNNNNNNNNNNNNNNNNNNNNNNNN
MARKER
1
Note
the
uctuations
in
the
delta
marker
amplitude
displayed
in
the
active
function
area.
When
the
signal
is
near
the
noise
oor
,
the
noise
contributions
will
cause
uctuation
in
the
marker
value
.
This
could
be
interpreted
as
overload
induced
error
when
NNNNNNNNNNNNNNNNNNNNNNNNNNNNNNNNNNNNNNNNNNNNNNN
LINEARITY
CHECK
is
activated.
T
o
reduce
the
uctuation,
decrease
the
averaging
bandwidth
by
pressing:
4
BW
5
N
NNNNNNNNNNNNNNNNNNNNNNNNNNNNNNNNNNNNNNNNNNNNNN
AVG
BW
AUTO
MAN
:
:
:
:
:
:
:
:
:
:
:
:
:
:
:
:
:
:
:
:
:
:
:
:
:
:
:
:
:
:
:
:
:
:
:
:
:
:
:
:
1
4
kHz
5
Note
the
absolute
level
of
the
marker
delta
readout
and
the
reduced
range
of
the
uctuation.
Making
EMI
Diagnostic
Measurements
6-31