


02.11.2018
14
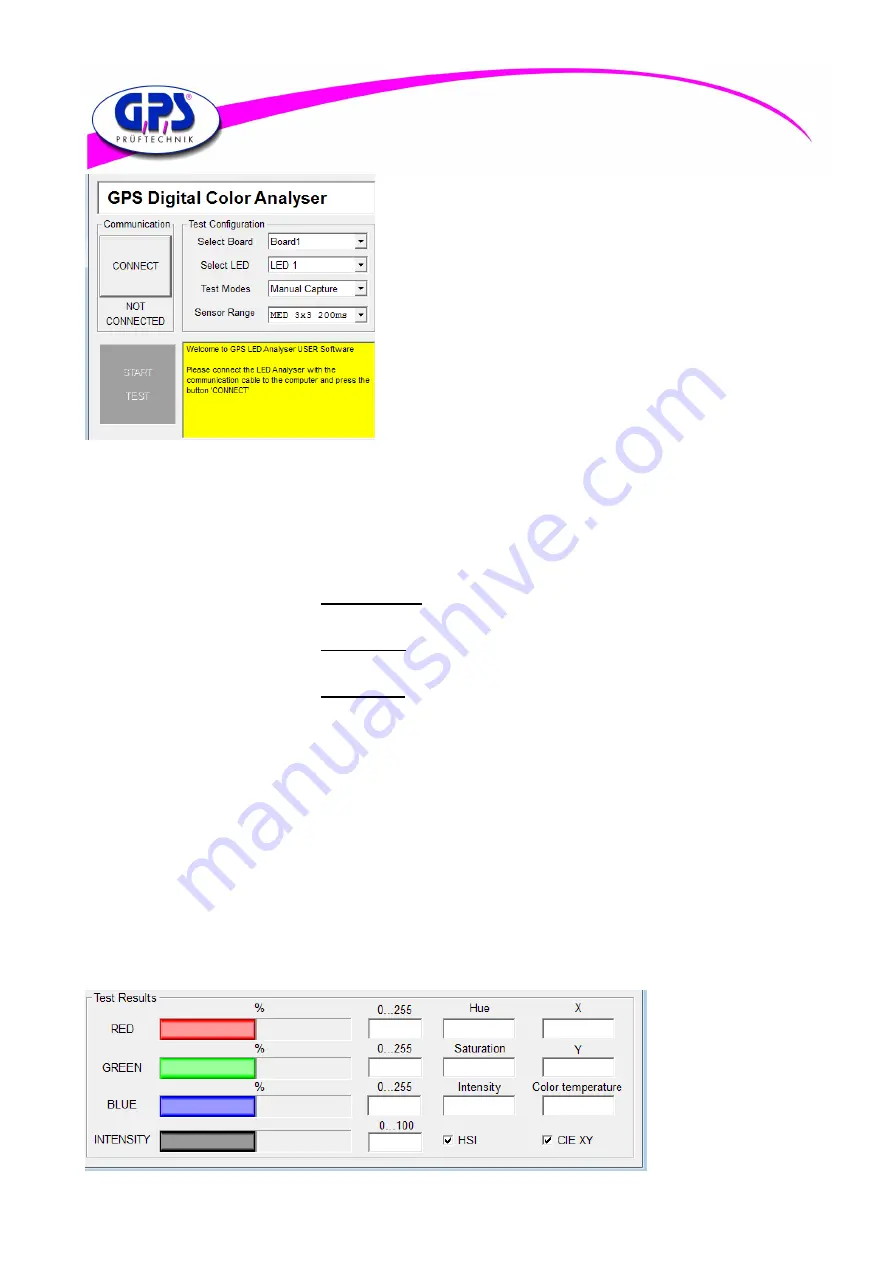
Figure 14.2: Detail main screen
The graphic beside shows a detail of the main screen of the LED
Analyzer. The following steps explain the functions of the individual
controls:
Connect Button After pressing the “Connect Button” the
LED Analyzer is connected with the
software. In doing so the button label
turns into “Disconnect”. After pressing
once again the LED Analyzer Board is
logged off.
Not Connected Label Shows the particular connection status
of the LED Analyzer Board.
Start-Test-Button Software performs a measurement with
the actual configuration.
Select Board Allows the selection of the connected
boards.
Select LED Allows the selection of a determined sensor on the LED Analyzer Board .
Test Modes Depending on the application different test modes are available:
- The
Manual Capture
mode allows to select predefined exposure times and sensor
surfaces through the sensor range menu. The right choice of the exposure time depends
on the light intensity of the test object.
- The
User Capture
mode enables the user to specify exposure time and sensor surface
through the sensor configuration individual. The software allows exposure times from
1 ms—1000 ms .
- The
PVM Capture
mode is predestinated to define the colour values of pulsed LEDs.
In this procedure this mode transfers the settings of the sensor regarding exposure
time and sensor surface of the last performed measurement. By selecting the average
factor which appears after choosing the PVM mode the user defines the number of
measurements which have to be done. As soon as the LED Analyzer captures the LED
in the ON-state, during the automatically performed measurements, the colour
parameters are stored and are shown to the user after the complete measurement
process is done.
Information Screen The yellow marked information window informs about the used LED Analyzer Board
firmware and the number of the connected boards. It also informs about eventually
appearing errors.
In the window “Test results” (see figure below)all light parameters which have been captured and calculated by the LED
Analyzer are shown to the user.
The captured colour values are shown to user in three different colour spaces. In the window on the left, you see the RGB
values, followed by the HIS ( Hue—Saturation—Intensity) up to the chromaticity coordinates x and y from the CIE 1931
Colour space. In the lower right part the Corelated Colour Temperature (CCT) is shown additionally.
Bild 14.3: Test Results ( main screen )