3
Select
Name
, enter a name, and select
Done
.
4
Select
Type
, and select the type of sensor.
5
Select
Style
, and select the style of sensor.
6
Select
Tank Capacity
, enter the capacity of the tank,
and select
Done
.
7
Select
Calibration
, and follow the on-screen
instructions to calibrate the tank levels.
If you do not calibrate the tank levels, the system uses
default settings for the tank levels.
Setting the Fuel Alarm
CAUTION
The Beeper setting must be turned on to make alarms
audible (
). Failure
to set audible alarms could lead to injury or property
damage.
You can set an alarm to sound when the total amount of
remaining onboard fuel reaches the level you specify.
1
Select
Options
>
Settings
>
Alarms
>
Fuel
.
2
If necessary, select a driveline.
3
Select
On
.
4
Enter the remaining amount of fuel that triggers the
alarm.
5
If necessary, repeat steps 2–4 for all drivelines.
Setting the Exhaust Aftertreatment System
(EATS) Mode
Read the Volvo Penta
Operator Manual
for more detailed
information.
When the chartplotter is connected to a compatible Volvo
Penta engine, it could be possible to select the Exhaust
Aftertreatment System (EATS) mode.
1
Select
Options
>
Settings
>
My Vessel
>
EATS
.
2
Select an option.
Adding Exhaust Aftertreatment System (EATS) Data to
a Gauge Page
When the chartplotter is connected to a compatible Volvo
Penta engine, it could be possible to select the following
gauges:
• UREA Level
• UREA Temp
• SCR Inlet Temp.
• SCR Outlet Temp.
• UREA Average Consumption
To view an EATS gauge, you need to add it to the gauge
page.
1
Select
Vessel
>
Engine
.
2
Select
Options
>
Edit Gauge Pages
.
3
Select a gauge to edit.
4
Select
Replace Data
>
Engine
.
5
Select the EATS data to display.
Viewing Graphs
Before you can view graphs of various environmental
changes, such as temperature, depth, and wind, you must
have an appropriate transducer or sensor connected to
the network.
Select
Info
>
Graphs
.
TIP:
You can view different available graphs by
selecting Change Graph, and selecting a new graph.
Setting the Graph Range and Time Scales
You can indicate the amount of time and the range of
depth that appear in the depth and water temperature
graphs.
1
From a graph, select
Graph Setup
.
2
Select an option:
• To set a time-elapsed scale, select
Duration
. The
default setting is 10 minutes. Increasing the time-
elapsed scale allows you to view variations over a
longer period of time. Decreasing the time-elapsed
scale allows you to view more detail over a shorter
period of time.
• To set the graph scale, select
Scale
. Increasing the
scale allows you to view more variation in readings.
Decreasing the scale allows you to view more detail
in the variation.
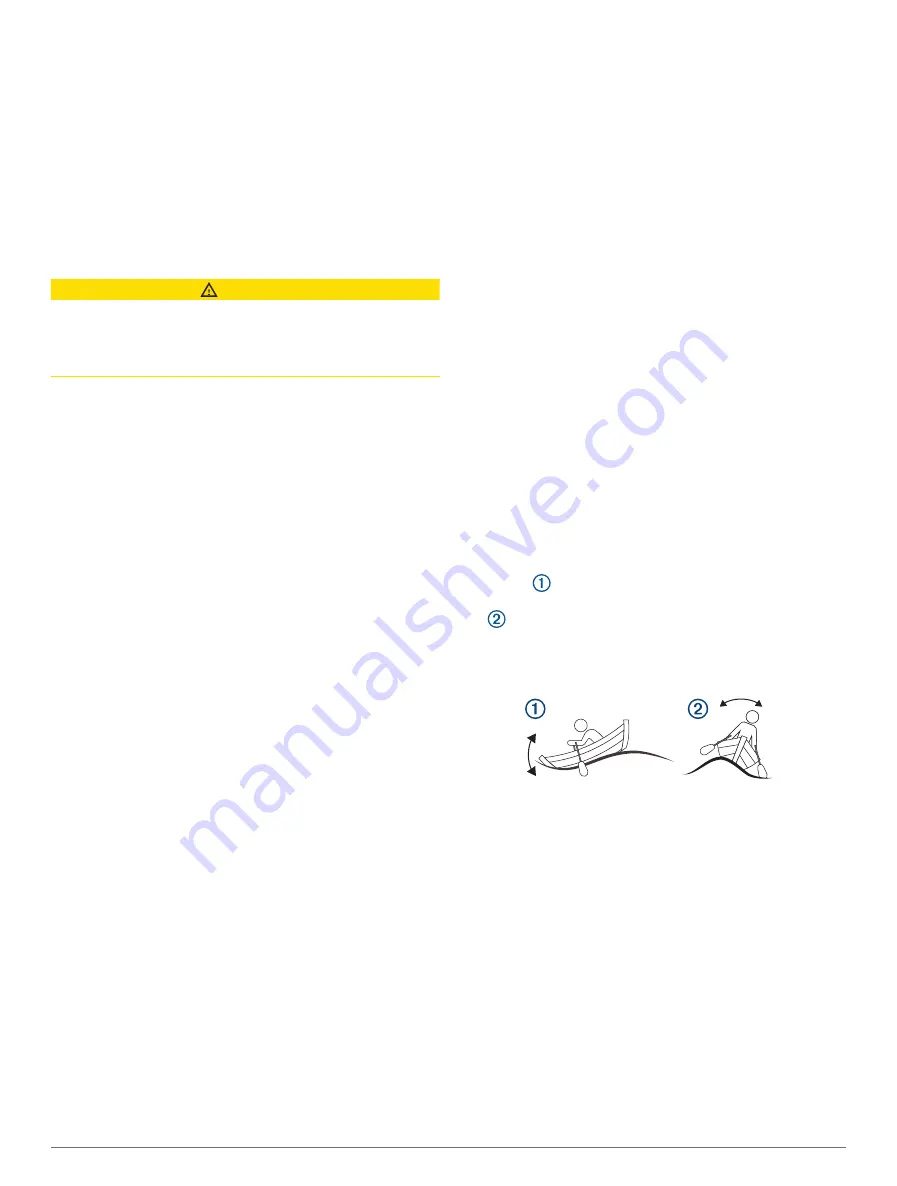
Adjusting the Active Trim
Active trim controls the amount of pitch and roll of your
boat. Pitch
is the forward and backward motion of your
boat on its center axis, relative to the surface of the water.
Roll
is the side-to-side motion of your boat on its center
axis. You can adjust the active trim to limit the amount
of degrees your pitch and roll are from your desired trim
levels.
1
Select
Vessel
>
Active Trim
.
2
Select an option:
• To adjust the forward and backward motion, select
Active Pitch
.
• To adjust the side-to-side motion, select
Active
Roll
.
Adjusting the Active Trim Sensitivity
You can adjust the active trim sensitivity to limit the
amount of degrees your pitch and roll are from your
desired trim levels.
1
Select
Vessel
>
Active Trim
>
Options
>
Active
Sensitivity
.
2
Adjust the level of sensitivity.
64
Gauges and Graphs


