


MCTB
114
to a minimum of 6 seconds. Thus, the update rate will vary from a minimum of 6 seconds (for time periods of
72 minutes or less) up to a maximum of 120 seconds for 1440 minutes (24 hours).
The
Labels
button allows the user to cycle through each of the configured plot channels to determine what
each colored plot represents as well as view the current value without having to return to the Single or Dual
view screens. The left and right scroll buttons at the upper right of the screen allow the user to cycle through
each of the four available charts.
The charts also
allow you to “zoom in” on a particular area to have a more detailed look at current data. By
using your finger to select an area on the screen, the chart will zoom in on that area. To select a portion of the
plot, touch and hold the screen with your finger. Drag your finger across the graph and a box will be drawn
around the selected area. Removing your finger from the screen will cause the chart to redraw with only the
selected plot
area. To return to the normal view, touch the ‘X’ or ‘Y’ axis and select zoom out to return to the
previous zoom setting or zoom normal to return to the full display.
NOTE: When a chart is zoomed in, it will not update with new information. The chart must be in normal view
mode in order to update at each time interval. The chart will return to normal automatically when
selecting a different screen to view.
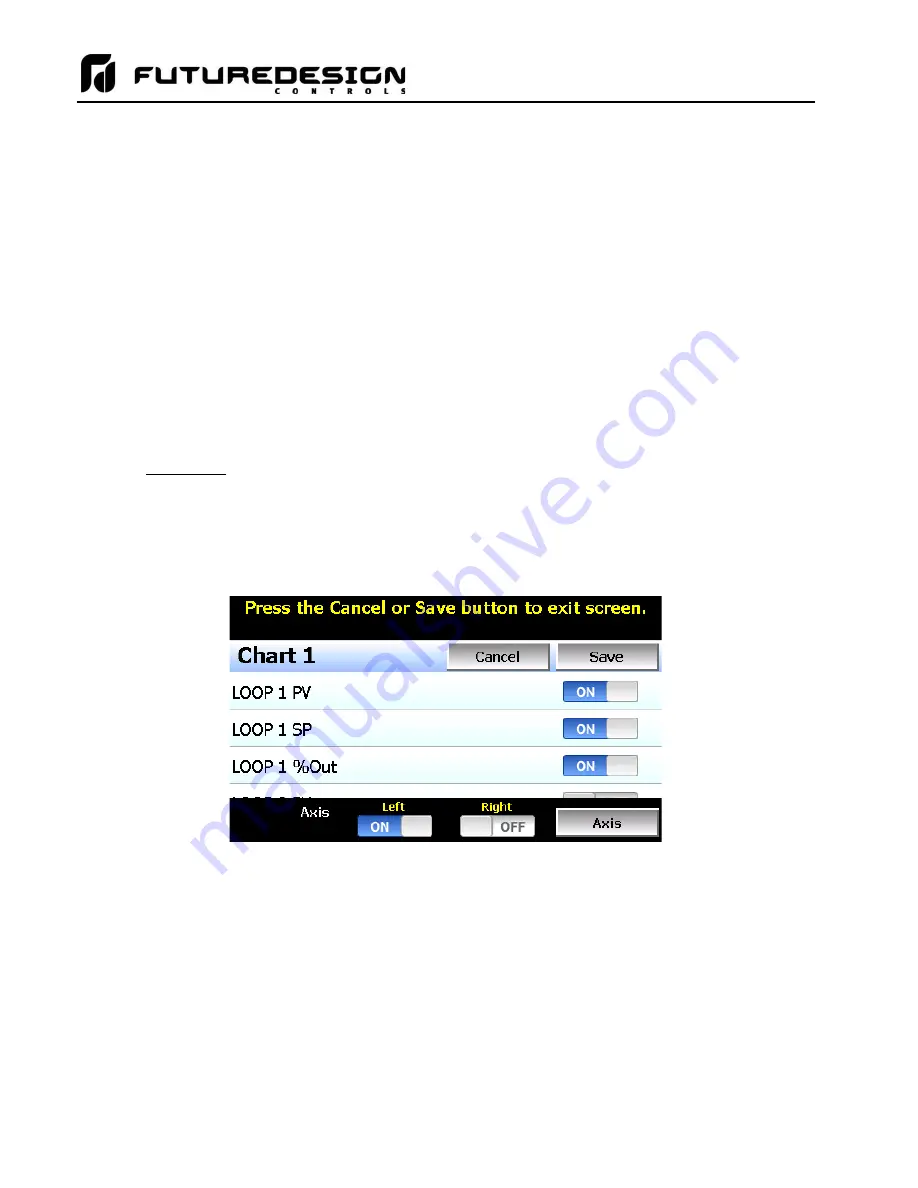
5.6.1.1
Chart Setup
To configure a chart, press
the “Set” button in the upper right corner of the display. The setup screen will be
shown. To assign channels to the chart, simply touch the on/off button for the desired items in the list to select
them. Select the left or right vertical axis for each item by selecting the item in the list and press the button for
the desired
“Left” or “Right” axis. The left axis is the default axis selection. If none of the channels are assigned
to the right axis, the axis will not be shown on the chart.
Once the channel selections have been made, press the
“Axis” button to adjust the time period and vertical axis
ranges of the graph.
Summary of Contents for MCTB 4.3
Page 24: ...MCTB 24...
Page 195: ...MCTB 195...
Page 227: ...MCTB 227 A 5 SmartIO Monitor Module Specifications...
Page 228: ...MCTB 228 A 6 Expansion IO Module Specifications...
Page 229: ...MCTB 229 A 7 Power Supply Specifications DIN Rail Mount Power Supply Specifications...
Page 230: ...MCTB 230...
Page 231: ...MCTB 231 Open Frame Power Supply Specifications...
Page 232: ...MCTB 232...
Page 233: ...MCTB 233 A 8 Power On Delay Relay Specifications GE1A C10HA110...
Page 234: ...MCTB 234...


