background image

7 Operations of CEMS2000 Monitoring Software 

90 

FOCUSED  PHOTONICS  INC 

Step 2


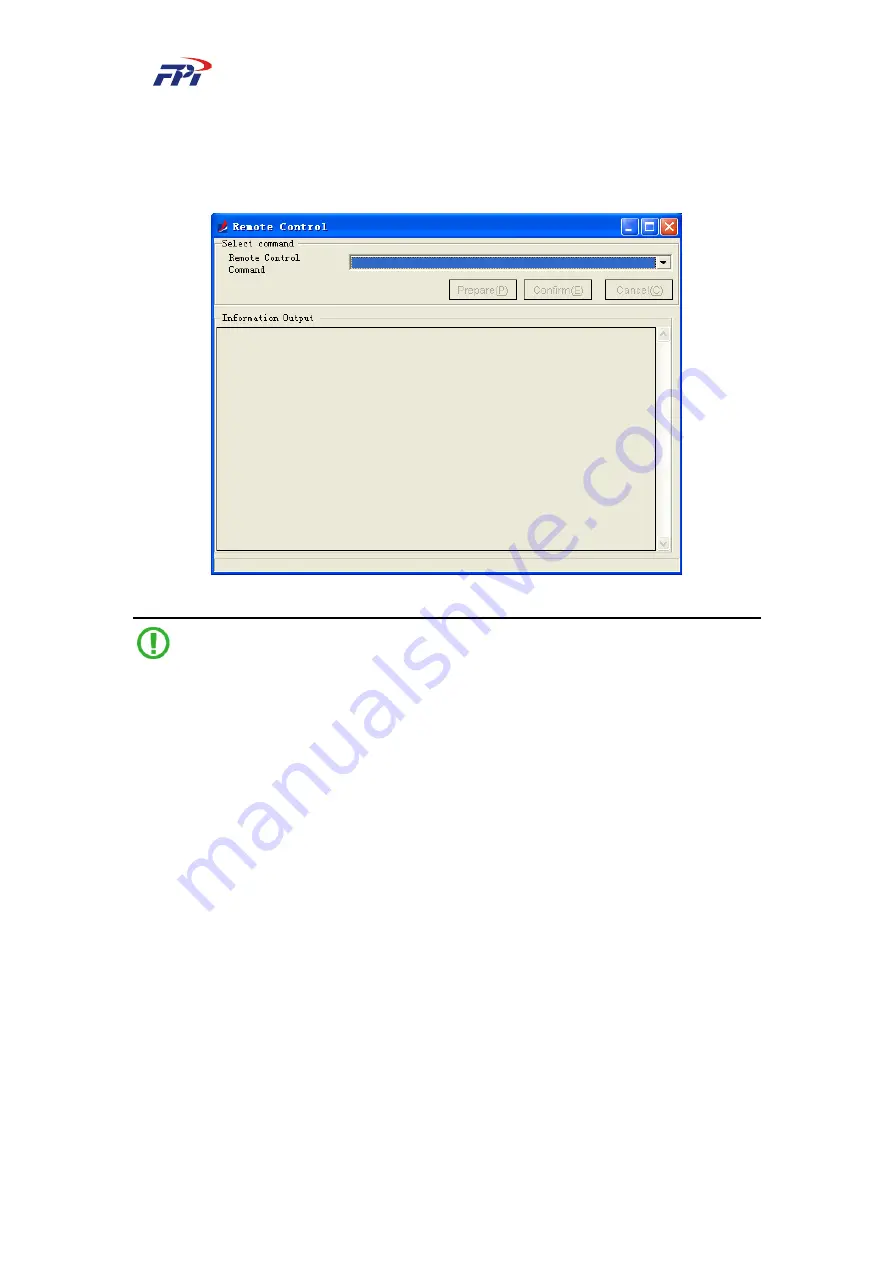
If you select the operation of zero adjustment or calibration, you should click the 

“Prepare” button first. The electro-valve will be activated to input the standard gas. 

Step 3


Click the “OK” button to start the remote control to the system. 


Fig 7-51


Remote Control 

Note: 

If you select automatic purging from the list of “Remote Control Command”, the system will 

start the automatic purging. The automatic purging will perform the probe purging and then 

followed with flow rate purging. Please refer to 

5.3.2.3 Purging Parameters

 for more information 

of configuring purging parameters. 

7.3.4 

Instrument Alert 

This function is used for checking and setting the alert information by the users including two 

sub-menus which are checking alert and configuring alert. 

7.3.4.1


 Checking Alert 

You can check the alert information in the alert information window, including the current 

alerts and history alerts. The alert information contains relevant information like the time, source, 

code and level of the alert. 

z


The page of current alerts shows the last 40 alerts. If the alert is covered, it will not 
display this alert at the next time of opening this page. You can click the “Close” button 
to return to the main window of the system. 

Summary of Contents for CEMS-2000 Series

Page 1: ...CEMS 2000Series Gas Analysis System User Manual Focused Photonics Inc UMCEMS30000812100 FOCUSED PHOTONICS INC...

Page 2: ...the accurate analysis result Besides proper transportation storage installation operation and maintenance will help the system to work safely and efficiently This manual introduces the routine operat...

Page 3: ...se information are displayed with particular icons and followed with detailed description Icon Description Hint information Common hint information during the usage of product or the part which needs...

Page 4: ...ng but not limited to 1 Incorrect use water seepage corrosion fire or HV shock 2 Force majeure earthquake lightening or flood 3 Unauthorized change or modification inside the product 4 Non compliance...

Page 5: ...rements XVI 2 2 Electricity Safety XVII 2 2 1 High Voltage XVII 2 2 2 Power Cable XVIII 2 2 3 Tools XVIII 2 2 4 Drilling XIX 2 2 5 Thunderstorm XIX 2 2 6 Electrostatic XX 2 3 Fuse XX 2 4 Ultraviolet L...

Page 6: ...rmal Mode 32 6 2 3 Failure Mode 32 6 3 Menu Structure of the System 33 6 4 Main Page 35 6 5 Instrument Setup 36 4 5 1 Communication Setup 37 6 5 2 Instrument Information 39 6 5 3 Alert Setup 40 6 5 4...

Page 7: ...System Help 104 5 5 1 User Manual 105 7 5 2 About the System 105 7 6 Window 106 8 Maintenance 108 9 Alert Information and FAQ 109 9 1 Alert Information 109 9 2 Frequently Asked Questions 111 The main...

Page 8: ...nd Processing Sub System 12 Fig 3 1 OMA 2000 Spectroscopic Gas Analyzer 13 Fig 3 2 CEMS 2000s Monitoring Software Screen 14 Fig 3 3 System Power Switches 15 Fig 3 4 High Pressure Gas Bottle 16 Fig 3 5...

Page 9: ...4 8 Main Page 35 Fig 4 9 Password Input Page 36 Fig 4 10 Instrument Setup Page 1 36 Fig 4 11 Instrument Setup Page 2 37 Fig 4 12 Communication Setup 37 Fig 4 13 Baud Rate Setup 38 Fig 4 14 Instrument...

Page 10: ...Setup 54 Fig 4 40 Density Alert Setup 55 Fig 4 41 Unit Setup 56 Fig 5 1 Main Menu and Main Window 58 Fig 5 2 System Management 59 Fig 5 3 User Logon 59 Fig 5 4 User Logout 60 Fig 5 5 Changing User Pas...

Page 11: ...ion of Linear Coefficient 76 Fig 5 31 Configuration of Fixed Value 77 Fig 5 32 Configuration of Display Unit 77 Fig 5 33 Data Configuration during Instrument Maintenance 78 Fig 5 34 Naming of Measurin...

Page 12: ...Fig 5 59 Deleting Alert Level 94 Fig 5 60 Daily Report 95 Fig 5 61 Monthly Report 96 Fig 5 62 Quarter Report 96 Fig 5 63 Annual Report 97 Fig 5 64 Daily Report Curve 97 Fig 5 65 Operations to the Cur...

Page 13: ...CONTENT OF FIGURES XII FOCUSED PHOTONICS INC Fig 5 80 Layout of Main Window 107...

Page 14: ...ertification Service Inc 1 3 Immunity This equipment was tested for Industrial level EMC as follows Per 2004 108 EC EMC EN 61326 1 Electrical Equipment for Measurement Control and Laboratory Use EMC r...

Page 15: ...ion limits Supporting test records by Compliance Certification Service Inc and certified compliance by FPI Standards include EN 61000 3 2 2006 Limits for harmonic current emissions EN 61000 3 3 A2 200...

Page 16: ...to understand these basics of safety operation In performing various operations please follow the local safety regulations The safety precautions introduced in the product manuals are supplementary an...

Page 17: ...t damage if safety precautions are ignored 2 1 2 General Requirements In order to reduce the technically unavoidable residual risk to a minimum it is imperative to follow the rules below z Read all th...

Page 18: ...f FPI z Any fault and error that might affect safety must be reported immediately by the user to the person in charge z Removal or disabling of safety facilities troubleshooting and maintenance of the...

Page 19: ...removal of live power cable is prohibited strictly Transient contact between the core of power cable and conductor may generate electric arc or spark which may lead to fire or eye injury z Before the...

Page 20: ...protection gloves must be worn and the cables inside the rack should first be removed z During the drilling make sure that the eyes of the operator are well protected The spattering swarf may cause i...

Page 21: ...tromagnetic field that will remain with the human body for a long time z Before touching the equipment hand holding circuit boards a grounded electrostatic discharge ESD wrist strap should be worn to...

Page 22: ...2 6 1 Lifting Heavy Objects Warning When lifting heavy objects it is prohibited to stand or walk under the arm or the lifted object 2 6 2 Sharp Objects Warning When the equipment is carried by hand pr...

Page 23: ...tegrated emission standard of air pollutants HJ T76 2007 Specifications and Test Procedures for Continuous Emission Monitoring Systems of Flue Gas Emitted from Stationary Sources on trial HJ T75 2007...

Page 24: ...via optical fiber which makes the maintenance and replacement of each component easier and at low cost High Accurate Measurement z The integrated high temperature sampling unit is adopted to ensure th...

Page 25: ...cision 0 5 F S Measurement Range 10 10 kPa Pressure Measurement Precision 0 5 F S Measurement Range 1 40 m s Gas Parameter Flow Rate Measurement Precision 1 F S OMA 2000 Input 9 CH analog input channe...

Page 26: ...4 Class of Protection IP65 Cabinet Ambient Temperature Range 5 40 Note z The measurement of gaseous pollutants can be also used for measuring the composition of customer specified other gases z The de...

Page 27: ...action Probe Position Inside the integrated sampling cabinet Separate probe Tracing Pipe N A Equipped Position of Probe Purging Electronic Valve Inside the integrated sampling cabinet Inside the purgi...

Page 28: ...Fig 4 2 show the difference of on site mode and extraction mode Fig 4 1 CEMS 2000 SystemArchitecture Wall mounted Fig 4 2 CEMS 2000 SystemArchitecture Rack mounted As illustrated in the above figure t...

Page 29: ...Monitoring Sub System The gaseous pollutants monitoring sub system adopts the special technology of hot humidity method owned national patent The principle is the system measures the SO2 and NOX inclu...

Page 30: ...2000 analyzer is shown as Fig 4 4 Fig 4 4 Exterior of OMA 2000 Analyzer Each part performs functions as below z Light source The pulse xenon light source is adopted for supplying the particular band...

Page 31: ...sting technology and featured of advantages like fast response and high testing sensitivity Its testing is based on in situ measurement mode The emitter unit and reflector unit of LDM 100 laser dust m...

Page 32: ...ple Pressure sensor z Range 10 10 Kpa optional according to actual conditions z Accuracy 0 5 z Input power 24V DC z Output current Two wire 4 20 mA 4 3 3 Flow Rate Transmitter z Instrument Flow rate m...

Page 33: ...e information of temperature sensor flow rate transmitter pressure transmitter and TPF 100 integrated transmitter Note The humidity of stack gas is measured by the humidity measurement module develope...

Page 34: ...department Also the software can connect to the internal enterprise DCS network Fig 4 9 Data Acquisition and Processing Sub System Please refer to Chapter 5 Operation Instructions of CEMS 2000 for mo...

Page 35: ...libration as shown in Fig 5 1 Please refer to Chapter 4 Operation Instructions of OMA 2000 Spectroscopic Gas Analyzer for its operations Fig 5 1 OMA 2000 Spectroscopic Gas Analyzer 2 The CEMS 2000s mo...

Page 36: ...0 4 MPa 0 6MPa should be prepared and connected 3 The optical fiber should be firmly connected and its bend radius should be more than 8cm 4 The gas exhaust should be inducted with a pipe to outdoor...

Page 37: ...ut certain range density gas to calibrate The calibration of system cabinet measured parameter SO2 NO and O2 can be performed by OMA 2000 analyzer The detailed calibration operations of parameters lik...

Page 38: ...controlling the flow rate of standard gas It is used to adjust the gas flow rate during zero adjustment and calibration by adjusting the knob of the flow meter Normally the flow rate of CEMS 2000s Sy...

Page 39: ...juster to a proper pressure value Normally the low pressure meter should be maintained around 0 2 MPa Step 2 Click one of the gas composition management page on OMA 2000 analyzer to enter the zero adj...

Page 40: ...he zero adjustment is finished the system will return to the manual zero adjustment page in Fig 5 6 but the prompt of Start to adjust is not available 5 3 3 2 Manual Zero Adjustment on CEMS 2000 Monit...

Page 41: ...8 Remote Control Menu Fig 5 9 Remote Control Page In the remote control page shown inFig 5 9 you can select the Zero adjustment command in the list of Remote Control Command as shown in Fig 5 10 Fig 5...

Page 42: ...emotely adjust the zero point 5 3 3 3 Auto Zero Adjustment on CEMS 2000 Monitoring Software You can configure the auto zero adjustment parameters on CEMS 2000 monitoring software and the system will p...

Page 43: ...ttings 5 3 4 Calibration The customer can calibrate SO2 NO and O2 in the range calibration in auto calibration mode or manual calibration mode The user should input the standard gas to be measured bef...

Page 44: ...er the calibration page as shown in Fig 5 13 Fig 5 13 Zero Adjustment Page on OMA 2000 Analyzer Step 3 Press the F3 button to enter the manual calibration page as shown in Fig 5 14 and start the proce...

Page 45: ...ion in Progress The system will return to the page in Fig 5 14 but the prompt of Start to calibrate is not available 5 3 4 2 Manual Calibration on CEMS 2000 Monitoring Software You can carry out calib...

Page 46: ...the calibration electro valve Then adjust the flow rate meter for the standard gas at bottom left of the cabinet front panel to control the flow rate at 1 5 2 L min and click the OK button to start r...

Page 47: ...ion page Fig 5 19 Calibration Parameter Menu Fig 5 20 Calibration Parameter Settings The meanings of items in the page z Calibration density of SO2 Set the calibration density of SO2 z Calibration den...

Page 48: ...performance of CEMS 2000s System in extreme conditions it requires using the purging gas to clean the probe and TPF 100 integrated transmitter to avoid the pollution to the probe caused by the dust or...

Page 49: ...nel of OMA 2000 Optical Fiber SpectrumAnalyzer The operation panel of OMA 2000 optical fiber spectrum analyzer is composed of four parts information area selection buttons function buttons and number...

Page 50: ...l switch to the instrument settings page if the user press down the Set button and input the password Note During the input of figures the Set button can be used as minus symbol Meas button Used to ba...

Page 51: ...splay the password input dialog box as shown in Fig 6 3 Fig 6 3 Main Page Input Password Step 2 Input the password using number buttons in the dialog box shown in Fig 6 3 The default password is 11111...

Page 52: ...6 4 Changing Password Step 4 Input the new password using the number buttons When the page prompt you Please enter the password again as shown in Fig 6 5 you should input the password again and press...

Page 53: ...tomatically works in startup mode after OMA 2000 analyzer has been normally powered up OMA 2000 analyzer performs initialization tasks under this mode and the LCD displays the startup picture which in...

Page 54: ...essure is abnormal or the gas path has been blocked In the meantime the LCD of the operation panel will display the density of measured gas and the bottom of the LCD will light up the alert status lik...

Page 55: ...rations to the users The instrument menu is the public operation management to the whole instrument including 8 functions of communication setup instrument information alert setup parameter setup time...

Page 56: ...6 Operations of OMA 2000 Spectroscopic Gas Analyzer 34 FOCUSED PHOTONICS INC Fig 6 8 Menu Structure...

Page 57: ...stem b Displays the current measured composition of gas c The lower limit of the current measured gas d Density progress bar The percentage is consistent with the range ratio of the average density of...

Page 58: ...ET button on the main page and the system will display a password input box the initial password is 111111 as shown in Fig 4 9 Fig 6 10 Password Input Page Input the password using the number buttons...

Page 59: ...ord system purging and alert code The user can press the F1 F5 button to operate and enter setup 6 5 2 Communication Setup Press the F1 button on the instrument setup page in Fig 6 11 to enter the com...

Page 60: ...is recommended to select 57600 Step 7 After the baud rate is selected please return to the communication setup page in Fig 6 13 Press F3 button to confirm the setup Please follow the steps below to s...

Page 61: ...nformation is the 2nd item in the instrument setup menu as shown in Fig 6 16 The instrument information page displays 4 kinds of information instrument serial number software version spectrometer soft...

Page 62: ...s room temperature Set the minimal temperature in the gas room within the range of 0 80 z Lower limit of gas path jamming Set the minimal pressure in the gas room within the range of 0 100 KPa z Conti...

Page 63: ...meter setup page as shown in Fig 6 18 and Fig 6 19 Fig 6 18 Parameter Setup 1 Fig 6 19 Parameter Setup 2 The meanings of items on the parameter setup page are z Spectrometer The parameter setup relate...

Page 64: ...of a pixel as shown in Fig 6 21 Fig 6 21 Checking Spectrum Strength Please follow the steps below to check the spectrum strength Step 12 Press the F2 button and set the pixel using the number buttons...

Page 65: ...sensor while when the manual input is selected the user can manually input the pressure value Pressure calibration Press the F3 button to calibrate the pressure Fig 6 22 Pressure Parameter Setup z Te...

Page 66: ...the system measures the pressure from internal pressure sensor while when the manual input is selected the system will display the page as shown in Fig 6 24 and the user can manually input the tempera...

Page 67: ...ence Wet The output value after system test does not include water compensation The users should consider the water influence Humidity input method Select the input method of the humidity with measuri...

Page 68: ...ow rate z Temperature control Used for setting and reading the system temperature as shown in Fig 6 27 Fig 6 27 Temperature Control Setup The users can read the system temperature on temperature contr...

Page 69: ...ns Press the Enter button to confirm the time setup and press the ESC button to return to the instrument setup page The year can be set within 2000 2100 as shown in Fig 6 28 Fig 6 28 Time Setup 6 5 7...

Page 70: ...gain as shown in Fig 6 30 Input the password again and press the Enter button to confirm the password If the two inputs are the same the system will store the password and prompt that the password has...

Page 71: ...probe purging flow rate A purging and flow rate B purging Probe purging The purging to the sampling probe in the stack Flow rate A purging The purging to the full pressure tube in TPF 100 integrated...

Page 72: ...ve been configured please press the OK button to confirm the setup and press the ESC button to return to the instrument setup page Note CEMS 2000 System uses pulse purging The time between each end an...

Page 73: ...in Fig 6 34 Fig 6 34 Gas Setup The setup page of SO2 includes 4 functions which are zero adjustment calibration composition parameter setup alert density and unit setup The users can select the setup...

Page 74: ...y of the standard gas within the range of 0 50000 ppm z Manual zero adjustment Perform manual zero adjustment operations Please follow the steps below for manual zero adjustment Step 16 Press the F2 b...

Page 75: ...ge as shown in Fig 6 36 but the prompt of Start adjustment is be available z Manual calibration Perform the manual calibration operations Please follow the steps below to perform manual calibration St...

Page 76: ...in Fig 6 38 but the prompt of Confirm calibration is not available 6 6 2 Composition Parameter You can set the SO2 range zero point calibration coefficient and smoothness average times in the composit...

Page 77: ...Set the smoothness average times of the current gas within the range of 0 100 6 6 3 Density Alert The users can set the alert threshold for the density of the gas When the gas density exceeds the thre...

Page 78: ...6 Operations of OMA 2000 Spectroscopic Gas Analyzer 56 FOCUSED PHOTONICS INC Fig 6 42 Unit Setup...

Page 79: ...nfiguration instrument management system report system help and window Click on the navigation bar it will expand its sub menus as shown in 0 z Real time data area This area displays the real time sys...

Page 80: ...ator 1111 All functions User 0000 All functions except z System configuration z Logout log configuration and advanced settings under system management menu z Instrument parameter and instrument contro...

Page 81: ...og configuration options and exit as shown in Fig 7 1 Fig 7 1 System Management 7 1 1 Logon This sub menu provides the system logon function for the users Each user is classified as administrator or u...

Page 82: ...The logout window is shown as Fig 7 3 Fig 7 3 User Logout 7 1 3 Changing Password You can set or change the passwords for administrators and users The administrator has higher permission than the use...

Page 83: ...n to confirm the change or click the Cancel button to cancel the operation Note The default passwords for administrator are 1111 while for users are 0000 7 1 4 System Logs Users can check the logon in...

Page 84: ...Log File Select a log file and click the Open button to open it The log information will be displayed in the system log dialog box as shown in Fig 7 8 Fig 7 8 Displaying System Log 7 1 5 Log Configura...

Page 85: ...logs Select the log to be configured in the log configuration window The log number and name will be displayed in the window You can select multi selection is allowed the output of the log with option...

Page 86: ...m will display the running time on the status bar at the bottom right corner Fig 7 10 Options Note You need to restart the software to make the changes effective 7 1 7 Exiting System Select Exit Syste...

Page 87: ...onfiguration Menu 7 2 1 Communication Setup Users can configure the system communication parameters in the communication setup menu including the configuration of COM port and remote output as shown i...

Page 88: ...on to confirm the setup or click Cancel button to exit the configuration and back to the main window Note The select ports shall not be conflict with each other 7 2 1 2 Remote Output Configuration Thi...

Page 89: ...the COM port output configuration window as shown in Fig 7 15 select the link of Single channel GPRS and select the COM port baud rate communication protocol and sending interval Make sure you have s...

Page 90: ...2000 Monitoring Software 68 FOCUSED PHOTONICS INC Fig 7 16 Configuration of Single channel GPRS Output Click the button of Output Items The system will display the window as shown in Fig 7 17 Fig 7 17...

Page 91: ...ular communication protocols Some protocols cannot be edited Please refer to the assigned permissions after delivery of the goods Fig 7 18 Selected Variables Click the OK button to save the current se...

Page 92: ...nnel GPRS Output 3 TCP IP Output On the page of TCP IP output as shown in Fig 7 20 select the check box of TCP IP and set the IP address port number sending interval and communication protocol After t...

Page 93: ...Please configure the IP address and port number according to the receiver s configurations 7 2 2 Data Configuration The data configuration sub menu offers the functions of system data configurations i...

Page 94: ...ndow you can input the corresponding value of the constant in the Constant Value box Click the Save button to save the constant and click the Close button to return to the main window Note You should...

Page 95: ...ceeds the limit If it is not selected the system will only display the maximum or minimal value of the range After the configuration is finished please click the Save button to save the current settin...

Page 96: ...alue of variables exceeds the threshold the system will send out an alert Fig 7 25 Configuration of Alert Threshold Please follow the steps below to configure the alert threshold Step 22 Select the va...

Page 97: ...system will prompt you with a pop up window as shown in the figure below Fig 7 27 System Prompt 1 Click the Cancel button to return to the previous window and save the configurations After you click...

Page 98: ...ection value Click the button to move the variable to the right column of To be fitted You should at least input two groups of data and then click the button The system will calculate the data and dis...

Page 99: ...on editable status to editable status Input the fixed value in the box then click the Save button to save the current setting and click the Close button to return to the main window 7 2 2 7 Configurat...

Page 100: ...can set the range of the previous minutes for the data configuration during maintenance as shown in Fig 7 32 and click the OK button to finish the configuration Fig 7 32 Data Configuration during Ins...

Page 101: ...greement as shown in Fig 7 34 In this textbox you can select the start time and the end time then click the Start button to start filling the data Fig 7 34 Filling Missing Data If no data is missing w...

Page 102: ...the filling and click the Exit button to return to the parameter setup window 7 2 5 System Configuration Information This function is used for displaying the configuration information of each measurin...

Page 103: ...nt function 7 3 1 Instrument Information 7 3 1 1 Instrument Status This function is used for reading the instrument status for the users You can click the relevant button to read the status of spectro...

Page 104: ...will read the temperature and pressure in the gas room and displays the data in the textbox Fig 7 40 Temperature and Pressure of Gas Room Click the button at the top right of the window to return to...

Page 105: ...ithin the range of 3 5 v z Xenon light pulse time Set the pulse times of the xenon light within the range of 1 10 z Spectrum average times Set the average times of the spectrum within the range of 1 1...

Page 106: ...stment z Stabilizing time of zero adjustment Set the stabilizing time of zero adjustment which is counted from the system reaching zero point or the density is stabilized If the stabilizing time is pa...

Page 107: ...each probe purging z Flow rate purging interval Set the interval of flow rate purging z Flow rate purging time Set the duration of each flow rate purging for both flow rate A and flow rate B z Start t...

Page 108: ...wn in Fig 7 45 Fig 7 45 Correction Coefficient You can click the Read button to read the information of correction coefficient and click the Set button to save the settings Click the button at the top...

Page 109: ...t Parameters This function is used for reading and setting the gas measurement parameters by the users as shown in Fig 7 47 Fig 7 47 Gas Measurement Parameters To read the gas measurement parameters S...

Page 110: ...gas Please refer to 5 3 2 5 Gas Measurement Range Fig 7 48 Alert Threshold of Gas Density 7 3 2 8 Alert Parameters of Gas Room This function is used for reading and setting the alert parameters of th...

Page 111: ...as Room The meanings of items in this window are z Temperature input method Set the input method of gas room temperature with options of manual input or automatic measured z Preset temperature Set the...

Page 112: ...purging Please refer to 5 3 2 3 Purging Parameters for more information of configuring purging parameters 7 3 4 Instrument Alert This function is used for checking and setting the alert information by...

Page 113: ...according to the requirement To search the history alert Select the measuring point to be checked from the list of Measuring Point Specify the time range of Start Time and End Time for searching Click...

Page 114: ...vel Click the Add button as shown in Fig 7 55 Input the code name and level in the blank textbox and click the OK button to save the settings Fig 7 55 Adding Alert Level To edit the alert level Select...

Page 115: ...el Fig 7 57 Editing Alert Level To delete an alert level Select the alert level and click the delete button The system will display a prompt window as shown in Fig 7 58 Click Yes button to delete the...

Page 116: ...ion provides the data reporting and curve reporting of the measured data for users including 4 menus which are report searching curves history data searching and report parameters 7 4 1 Report Searchi...

Page 117: ...o show the report of the selected date The meanings of items in this window are z Export to Excel Export the searched data to Excel sheet z Export to Text Export the searched data to text file 7 4 1 2...

Page 118: ...the quarterly average data table based on monthly data The users can select the year and quarter to search the corresponding data as shown in Fig 7 61 The operations can be referred to 5 4 1 1 Daily R...

Page 119: ...arch the corresponding data as shown in Fig 7 62 The operations can be referred to 5 4 1 1 Daily Report Fig 7 62 Annual Report 7 4 2 Graphic Report 7 4 2 1 Daily Report Curve The daily report curve di...

Page 120: ...of the selected date Note The selectable parameter in the list are dust dry dust converted SO2 dry SO2 converted NO dry NO converted and flow rate The above parameter can be customized You can right c...

Page 121: ...ICS INC Fig 7 65 Page Settings z Print Print the report curve Fig 7 66 Printing z Point data Check the data of selected point Right click on the curve and select Show point data When you point the mou...

Page 122: ...to the default scale Note Select any section of the curve and drag the mouse to zoom in the curve This function is available on all the curves in this software 7 4 2 2 Monthly Report Curve The monthl...

Page 123: ...Quarter Report Curve The quarter report curve displays the curve based on the monthly data The users can select the year and quarter to search the corresponding curve as shown in Fig 7 69 The operati...

Page 124: ...n select the year to search the corresponding curve as shown in Fig 7 70 The operations to the annual report curve can be referred to 5 4 2 1 Daily Report Curve Fig 7 70 Annual Report Curve 7 4 3 Hist...

Page 125: ...ow are z Export to Excel Export the searched data to Excel sheet z Export to Text Export the searched data to text file txt z First Page Go to the first page z Previous Page Back to the previous page...

Page 126: ...f report template may takes long time it is recommended not to perform any operations during the creation The system will prompt the user after the report template is created Fig 7 74 System Prompt 7...

Page 127: ...operations of the system If you click the User Manual in the help menu a CHM format manual will be launched as shown in Fig 7 76 Fig 7 76 User Manual 7 5 2 About the System If you click About in the...

Page 128: ...tal cascade vertical cascade close all minimize all and maximize all The view layout offers the users settings of the layout of main window as shown in Fig 7 78 The selected view will be displayed in...

Page 129: ...ayout of Main Window If the you open more than one main window you can configure each of the windows with options of horizontal cascade vertical cascade close all minimize all and maximize all Menu Na...

Page 130: ...ctronic components z You should check if the external pressure is in the normal range If it is abnormal please check if the jet pump or the probe is jammed z You should check if the readings on IPC an...

Page 131: ...default configuration You need to re configure the optical channel 2 04 EEPROM error Failure Restart the system If the problem still cannot be solved you should change the EEPROM 05 Step motor error...

Page 132: ...control error Failure 27 Probe 2 temperature over limit Failure 28 Probe 2 sensor error Failure 29 Tracing pipe 1 temperature control error Failure 2A Tracing pipe 1 temperature over limit Failure 2B...

Page 133: ...and flow rate The pipe is jammed the sensor circuit is loosen short circuit or open circuit The zero point or measurement range has significant offset Check the pipe and circuit and troubleshoot the p...

Reviews: