

MPANT Software
ComTec GmbH
6-8
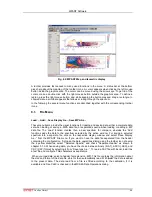
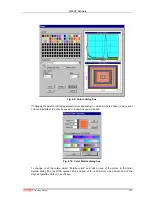
X-Projection, Y-Projection
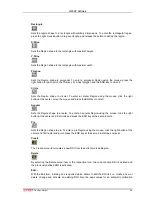
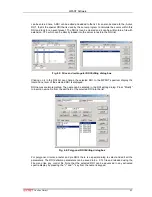
Projections of ROI's in dual parameter spectra to the x- and y-axes are now implemented. There
are new menu items "X-Projection" and "Y-Projection" in the Region menu. They create new
single spectra displays showing the respective projection of the selected ROI in a dual parameter
spectrum in the active window.
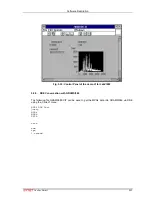
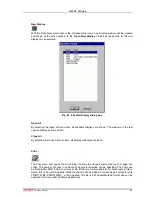
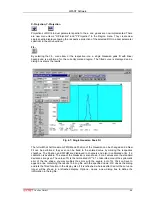
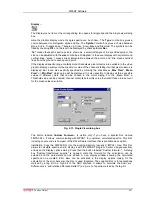
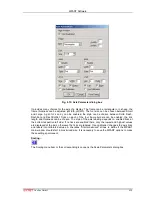
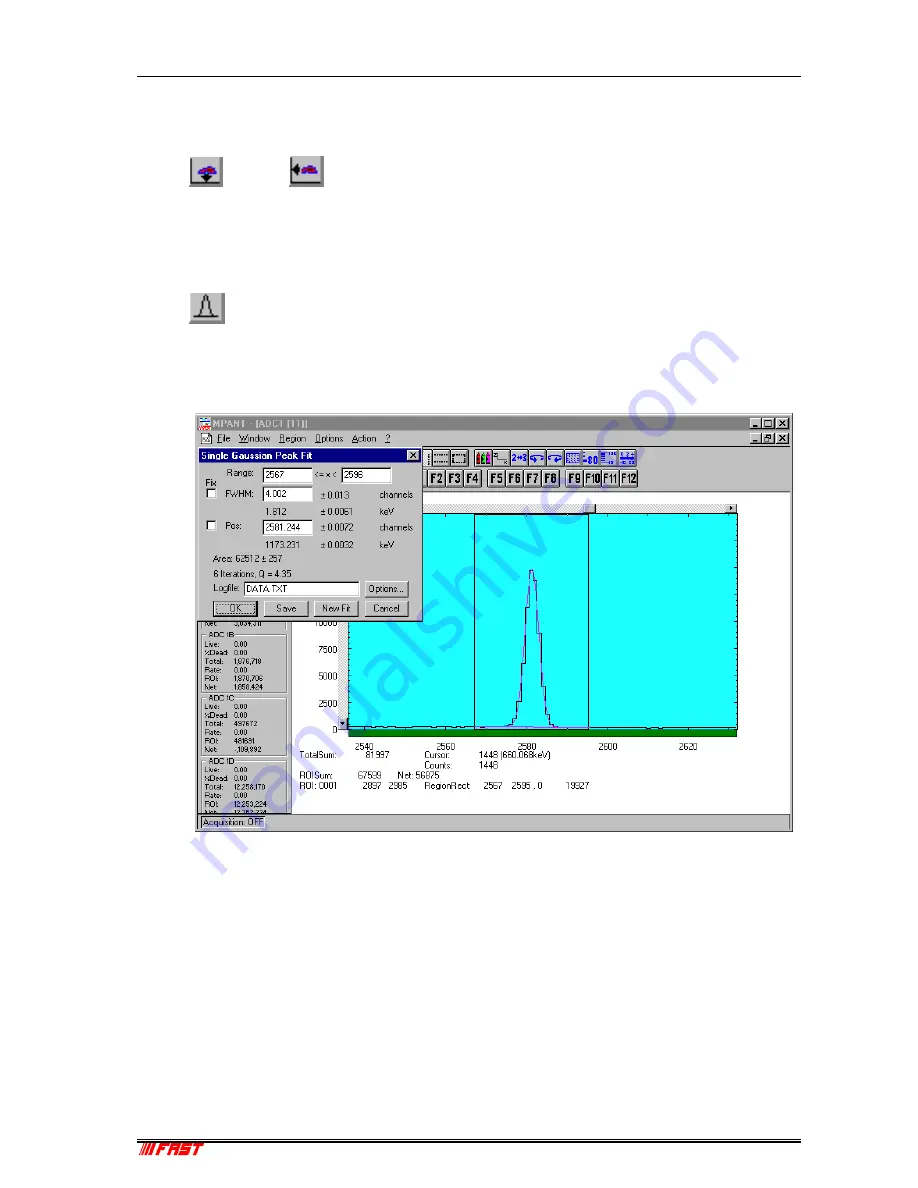
Fit...
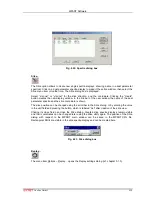
By selecting the Fit... menu item or the respective icon, a single Gaussian peak fit with linear
background is performed for the currently marked region. The fitted curve is displayed and a
dialog box shows the results:
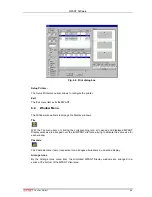
The full width at half maximum FWHM and Position of the Gaussian can be changed and a New
Fit can be performed, they even can be fixed to the entered value by marking the respective
checkbox. The Position and FWHM are displayed in channels and also in calibrated units, if a
calibration is available. The area of the Gaussian is also shown. For all values also the standard
deviations are given. The value of Q is the normalized chi**2. To take into account the systematic
error of the line shape, you may multiply the errors with the square root of Q. Click on Save to
append a line containing the results to a Log file with the specified name. OK closes the dialog
and lets the fitted function in the display also if it is refreshed, whereas after Cancel the curve no
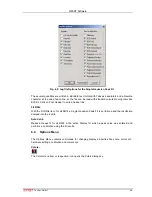
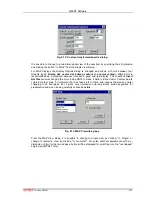
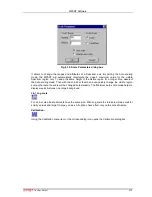
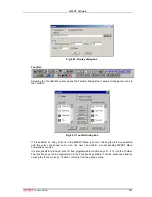
longer will be shown in a refreshed display. Options... opens a new dialog box to define the
information in the log file:
Fig. 6.7: Single Gaussian Peak Fit