MAW
®
User Manual Rev. 3.0
43
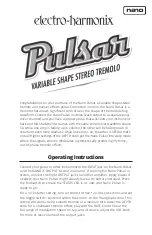
Several extra buttons appear in the graph view. The user can see temperatures and toggle
the graph ON/OFF for each zone by pressing the button corresponding to the zone number.
For workstations with compartments, the button will contain two values wherein two sep-
arate temperature curves will be shown.
Figure 22.6
Two values
Figure 22.7
The graph view
A zoom function is available by touching the screen and swiping left over the area that
should be zoomed.
By pressing the reset button, the user will go back to the full view.
If there is data accumulated, it is possible to shift between “week”, “day” or “hour” view.
The CO
2
button shifts views from temperature view to CO
2
gas view. Here the user can see
the historical data for flow and pressure.