234
dataPAC User’s Guide
Chapter 6 - Frequency Response Function (FRF)
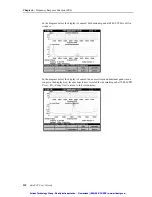
Note that the cursor is positioned on a point (14,620 CPM) that shows a fairly low level of
coherence (0.536). When comparing this to the accelerance trace on top, you can see that
this occurs on an anti-resonance and the input signal at this frequency is very low. With very
little input at this frequency, it is likely that the coherence is low. Outside of the two anti-
resonant frequencies, the coherence level is quite high and this would be considered good
data.
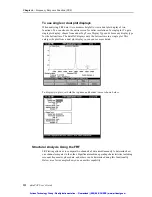
To use phase as a display option
In fundamental vibration training you learn that in the start-up or coast-down of a machine,
the machine may run through critical speeds that excite the shaft mass natural frequencies
and may cause significant increases in the vibration amplitude. You can use a Bode plot to
determine these critical speeds. The Bode plot measures a filtered 1X vibration amplitude
and phase against RPM. In addition to the increase in amplitude, the critical speed is
positively identified by a 180 degree shift in phase angle.
Structural resonances, like shaft critical resonances, also exhibit this characteristic 180
degree phase shift. To get a plot showing the phase readings vs frequency, change the data
type to Phase in the data display options.
Artisan Technology Group - Quality Instrumentation ... Guaranteed | (888) 88-SOURCE | www.artisantg.com
Artisan Technology Group - Quality Instrumentation ... Guaranteed | (888) 88-SOURCE | www.artisantg.com


