Collecting and Analyzing FRF Data
dataPAC User’s Guide
231
To improve display scaling using logarithmic displays
Logarithmic displays provide yet another means of viewing the data. To change the display,
press <F3> (Display Options). Then use the arrow keys to select Frequency Scale and press
<SELECT> to toggle between Linear and Logarithmic.
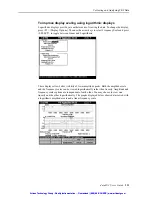
These displays allow better visibility of lower amplitude peaks. Both the amplitude scale
and the frequency scales can be viewed logarithmically rather than linearly. Amplitude and
frequency scales options are independent of each other. You may choose to view one
linearly and the other logarithmically. The graphs displayed below shows data viewed with
a logarithmic amplitude scale and a linear frequency scale.
Artisan Technology Group - Quality Instrumentation ... Guaranteed | (888) 88-SOURCE | www.artisantg.com
Artisan Technology Group - Quality Instrumentation ... Guaranteed | (888) 88-SOURCE | www.artisantg.com


