background image

62

Handheld Probe Scan 

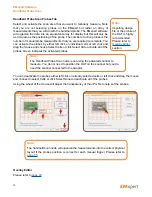
The handheld probe is meant to provide the user with a method to easily collect and display data from 
sensors other than the EMxpert probes. EMxpert is compatible with any sensor that the user wishes to 
use and that can be connected to a supported spectrum analyzer. 

Note that the function and operation of the Handheld Probe Scan is very similar to the Spectral Spatial 
Scan function. We will ask the user to refer to this section for many of the advanced features of the node 
and only deal with the data collection and differences in this section.

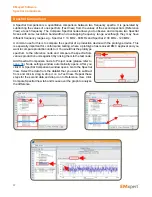
Add Handheld Probe Scan node to Project node (please refer to 

page 36

). Node settings window 

automatically opens.

Handheld Probe Scan inherits the setting parameters that were 
selected in the settings of the Project node (please refer to 

page 

39

). You can override any of the inherited setting parameters by 

modifying the tabs in the Handheld Probe Scan settings window. 
The tabs in the Handheld Scan Settings window are covered in 
the following pages.

Spectral Scan Tab

1.  Enter 

Start Frequency

 and 

Stop Frequency

 to identify the 

span of the Spectral Scan to be implemented. The Stop 
Frequency can be any frequency supported by the handheld 
probe and spectrum analyzer; it is not limited to the 4 GHz or 8 GHz limit of the EMxpert scanner.

2.  RBW (Resolution Bandwidth): 

It is set by default at 120 kHz and can be reduced to the lowest level 

allowed by the spectrum analyzer. Decreasing the bandwidth will improve the amplitude accuracy 
and increase the sensitivity; the scan will however take more time to complete. The bandwidth you 
choose should not be disproportionate to the span. The suggested ratio of Span/RBW should be 
<10,000 e.g. 10 kHz bandwidth with a 100 MHz span, 100 kHz bandwidth with a 1 GHz span so that 

the scan can finish in a reasonable time.

3.  Reference Level:

 This feature is no longer relevant and will be removed at the next software release.

4.  Measure Peaks:

 It activates the peak marking feature whereby peaks are rescanned at a tighter 

bandwidth in order to accurately measure the frequency as long as the peak’s value is 5 dB above 

the  average  noise  floor  of the  scan.  By default  the  maximum  number  of peaks  is  set to  10. The 

maximum number peaks that can be measured is 30. There is little value in activating this feature in 
the Handheld Probe node. 

5.  Peak Hold: This feature is not active for Handheld Probe Scan.

6.  Click Apply

EMxpert Software

Handheld Probe Scan

Caution:

INFORMATION REGARDING ALL ROHDE & SCHWARZ SPECTRUM ANALYZERS EXCEPT 

FSU AND FSL: The RBW is only selected from the list of available filters in the Gaussian (3dB) 

aka Normal folder. The EMxpert settings will default to the closest RBW if the requested filter is not 

available. For the FSL and FSU, the end-user can pre-select the Gaussian or the EMI folder on the 
spectrum analyzer before connecting to the EMxpert application. The EMxpert will then use the 

filters available in the selected folder.

Summary of Contents for EMxpert EHX

Page 1: ...EMxpert EHX User Manual ...

Page 2: ...d fitness for a particular purpose EMSCAN shall not be liable for errors or for incidental or consequential damages in connection with the furnishing use or performance of this document or any information contained herein Should EMSCAN and the user have a separate written agreement with warranty terms covering the material in this document that conflict with these terms the warranty terms in the s...

Page 3: ...SCAN if Buyer is under warranty original or extended You can extend your original warranty by purchasing option 3000 1810 or 3000 1811 Additional One Year Customer Care Package Is your document and EMxpert software up to date Periodically we update the documents and EMxpert software You may access to the latest versions from below links User manual http www emscan com emxpert EMx_userManuals cfm T...

Page 4: ...ectrum Analyzer Setup for EHX 25 Setup and Modes of Operation 29 Menu Bar 31 Quick Facts about Menu Bar 32 Viewing Scan Results 33 Spectral View 33 Spatial View 34 Nodes 36 How to Add a Node 36 How to Name a Node 36 How to View a Node 36 How to Delete a Node 37 How to Export Data 37 Preferences Analyzer and Display Options 37 Project Node Settings 38 Overlay Editor How to Superimpose Graphical Ima...

Page 5: ...on 68 Spatial Comparison 72 Measurement Tips 73 Scanning a PCB 73 Scanning a System Level Device 74 Appendix Frequently Asked Questions FAQ 75 Appendix Error Messages 80 Appendix Regulatory Compliance 82 Safety and Regulatory Information 82 FCC Class B Notice 83 CSA Certification 84 CE mark 84 Notes 85 Table of Contents ...

Page 6: ...t Phone Toll Free North America Only 1 877 367 2261 International 1 403 291 0313 ext 2 Fax 1 403 250 8786 E mail support emscan com Website www emscan com Address EMSCAN Corporation 1 1715 27th Avenue N E Calgary Alberta Canada T2E 7E1 The serial number is located at the bottom of the scanner Start EMxpert software and click to access to software and firmware versions Contact Information Serial Nu...

Page 7: ... switched array which provides an effective 3 75 mm resolution The system operates from 150 kHz to 4 GHz or 150 kHz to 8 GHz the upgrade from 4 GHz to 8 GHz is enabled with an optional software license key EHX is a self contained very near field scanning device which uses the EHX scanner along with a built in spectrum analyzer Simply connect the EHX into the PC with an Ethernet connection install ...

Page 8: ...ns to test above 6 GHz part numbers 3000 1806 and 3000 1808 8 EMxpert USB Drive includes the EMxpert software installation program and User Manual Customer Provided Components 1 SpectrumAnalyzer Itmustinclude thenecessaryoptionstowork with theEMxpertEHX see Supported Spectrum Analyzers It measures the radio frequency RF signal received from the EMSCAN s patented scanner generated by the very near ...

Page 9: ...even notice it Orange Initiation mode checking adaptor s firmware Green User mode adaptor is connected and ready 3 USB connection port 4 Micro D control cable connection 5 Micro D control cable connection 6 RF output port About EMxpert Connection Overview 1 3 2 4 Caution The surface of the scanner is made of Gorilla glass It may shatter if a sharp object is dropped from a distance 5 6 ...

Page 10: ...Additional one year Customer Care Package for the EHX ERX and ERX Includes Parts labour Software updates Free shipping to factory for repair and return Same day technical support Two 30 minute web training sessions per year 3000 1910 Calibration Assurance Plan for the EHX and ERX Return to EMSCAN 3 years Annual single calibration event included Freight to from EMSCAN factory not included unless un...

Page 11: ... for travel outside the Continental USA and Canada 3000 0902 Trainer s travel accommodations and expenses for travel within the Continental USA and Canada 3000 0903 Training at EMSCAN s Education Center per participant per day EMSCAN will provide equipment for the hands on training materials and lunch each day Course scheduling will be determined based on a minimum of 3 confirmed registrants Parti...

Page 12: ...ows Set your spectrum analyzer to the static IP address 172 16 1 148 255 255 0 0 you will probably have to restart your analyzer Set your PC with static IP address 172 16 1 99 255 255 0 0 Best is to set it up in Alternate Configuration in the Local Area Connection Properties Internet Protocol Version 4 TCP IPv4 Properties path in Windows 7 or equivalent path for other Windows OS If you want to use...

Page 13: ...are equal some are less than others and may not work with the EMxpert adapter Try various ports until you find one working properly The EMxpert driver is a third party Microsoft approved driver If the installation fails you must disable the third party driver enforcement of Windows 8 and 8 1 as follows Windows 8 0 On the side START bar click on Settings Click on Change PC settings In PC Settings c...

Page 14: ...select Manual Configuration and then LAN Instrument In Set LAN Address Hostname or IP Address Enter the IP address 172 16 1 148 In Verify Connection Click on Test this VISA Address Then click on Accept If there is still no connection disable your PC firewall or set it up to allow traffic to from 172 16 1 148 and repeat the steps above If you are using a Keysight X series spectrum analyzer please r...

Page 15: ...rum analyzer 2 Connect the B end of the USB cable to the USB port on the EHX Adaptor and A end to any USB port on the computer The LED light shows three stages Red Boot mode this stage is fast you may not even notice it Orange Initiation mode checking adaptor s firmware Green User mode adaptor is connected and ready Getting Started Hardware Setup ...

Page 16: ...the SMA end of the RF cable RF SMA to type N coaxial cable to the RF Output port of the patented scanner and the other end to the RF Input port front of the spectrum analyzer 5 Connect Crossover Ethernet cable between the spectrum analyzer SA and the PC 6 Setup the IP address of the SA to 172 16 1 148 7 Setup the Static IP address of the PC to 172 16 1 99 Getting Started Hardware Setup ...

Page 17: ...elect the software folder and double click on Setup exe file 2 When you are prompted Do you want to allow the following program from an unknown publisher to make changes to this computer click Yes 3 Click Next 4 Click Next Getting Started Software Installation ...

Page 18: ...18 5 Select I Agree and click Next 6 Below screen will be displayed Getting Started Software Installation ...

Page 19: ...e follow the next steps to install it You need an internet connection to download Keysight IO Library Getting Started Software Installation Note Several visa libraries may already be installed on your PC After installing Keysight Visa Library ensure that it is set as primary VISA You will be guided through the steps on page 25 ...

Page 20: ...ight website click on the Download button and follow the steps When the download is complete open the Downloads folder and double click IOLibSuite_17_1_19313 10 The folder will be unzipped 11 Click Next Getting Started Software Installation ...

Page 21: ...21 12 Select Agree and click Next 13 Select Typical and click Next Getting Started Software Installation ...

Page 22: ...15 If Microsoft Visual C is not installed on your PC below screen will be displayed Click Yes 16 While the software is installing the following screen will be displayed 17 Click Finish Getting Started Software Installation ...

Page 23: ...tomatically follow below steps Open the Device Manager and expand USB Custom Driver and right click on EMxpert USB Driver C 2014 and select Update Driver Software c Select Browse my computer for driver software d Select Include subfolders and click Browse and select the EMxpert USB drive and click OK Getting Started Software Installation ...

Page 24: ...24 e Click Next f Click Close to complete installation 19 Start the EMxpert EHX EMX Software by clicking the icon on the Desktop Getting Started Software Installation ...

Page 25: ...e make the following change to EMxpert ini in the directory where EMxpert exe is C Program Files x86 EMSCAN Corporation EMxpert 5 Open this file by using notepad there is the following section at the end Please check Technical Bulletin 9 if you have a Keysight spectrum analyzer Step 2 PC Setup Several visa libraries may already be installed on the PC Ensure that Keysight Connection Expert is set a...

Page 26: ...6 Select Keysight Visa as primary VISA and click Next Click Finish When you first connect to the spectrum analyzer open Keysight Connection Expert Getting Started External Spectrum Analyzer Setup for EHX ...

Page 27: ...ll doesn t detect the analyzer click Manual Configuration Select LAN instrument and enter the IP address 172 16 1 148 and click Accept Click Instruments tab to see that spectrum analyzer is successfully detected It has to be a favorite to operate and must have a yellow star Getting Started External Spectrum Analyzer Setup for EHX ...

Page 28: ...nnected to the PC properly After the adaptor is connected to the PC properly restart the EMxpert software If there is a connection problem between the spectrum analyzer and the PC an error message will be displayed as shown below Please refer to Quick Installation and Check List Getting Started External Spectrum Analyzer Setup for EHX Note If the IP address of the spectrum analyzer is set to 172 1...

Page 29: ...ectral Scan for the bandwidth of interest Run the Spectral Scan and analyze the test results If there is any ambient noise being displayed the EMxpert s comparison features will allow you to filter it from the actual DUT test results Modes of Operation 1 PCB testing smaller than the scan area Place the PCB directly anywhere on the grid of the scanner If there are tall components that prevent the P...

Page 30: ...equency and location 4 In situ testing EMxpert EHX model is light and compact The bottom part of EMxpert EHX is made of anodized aluminum making it non conductive Care must be taken to not pierce the anodized surface since the underlying aluminum is conductive Scanner can easily be placed in a rack mount system to test the PCBs in their working environment A mechanical arm may be required to fix t...

Page 31: ... Close a project Access to recent documents Quick Access Toolbar About EMxpert EMxpert Help Auto hide or pin the project view Spectral Overlay Module Node Spectral Spatial Scan Spectral Scan Buttons Spectral Comparison Report Generator Blindspot Reduction Handheld Probe Spatial Comparison Spatial Scan Preferences Stop Scan Settings Scan Once Scan Continuously Buttons Icons Start a new project Open...

Page 32: ... default Project View is pinned and displayed in the EMxpert software In order to maximize the space to view the scan results Project View can be hidden Click the pin icon to auto hide Project View Project View will be hidden and now you can maximize the scan window Spectral Spatial Scan windows automatically resizes to fit the screen To display Project View mouse over on Project View tab It will ...

Page 33: ...the checkmark boxes at the bottom of the graph Grid and Peaks can be hidden displayed Unit can be switched between dBuV and dBm Linear scale is the default settings of the graph Log Scale can be selected Peak and Scale Options are listed under View Options Left click and drag to zoom in Right click and select Reset Zoom to return to the original view or Previous Zoom to return to the previous zoom...

Page 34: ...f data smoothing in the image can be turned on off By sliding the Set Color Threshold on the right side of the graph you can increase or decrease the contrast to more clearly identify current loops and peak locations Peak and Scale Options are listed under View Options View can be changed to 3D by clicking on the check box You can rotate the 3D view by left clicking on the graph and moving the mou...

Page 35: ...vious Zoom to return to the previous zoom level Right click on the graph to display menu You can change some settings of the Spatial Scan via Settings or Open Scan Data Description which will give information about the scan and access to the Overlay Editor after a scan EMxpert Software Viewing Scan Results ...

Page 36: ...ted throughout the module tree only Modules can be used to store data for different revisions of the PCB Nodes that don t contain any data are light colored How to Add a Node To add a node either right click on the Project node click on Add Node and then select one of the scans or click on one of the icons on the side bar to the left of the Project node How to Name a Node To name a node open the S...

Page 37: ...nalyzer Display Options and Probe Compensation To access Preferences click on There are two tabs Analyzer and Display Options Analyzer Tab The Analyzer Tab lists models and firmware versions of the supported spectrum analyzers Although the EMxpert software detects the spectrum analyzer automatically you can override it by manually selecting the spectrum analyzer from the drop down menu If you conn...

Page 38: ...ers for far field prediction and comparison with handheld or automated probe measurements Compensation can be quite high at some frequencies If you select Peaks noise peaks above the threshold are compensated while the noise floor is not making any peak look like strong signals If there is any doubt as to whether a compensated peak is in fact present turn off the compensation altogether or select ...

Page 39: ... frequency of an intermittent or random signal Replace Data When Running Continuously If you Scan Continuously when this option is checked EMxpert software replaces the previous scan data and keeps the last scan data In order to keep all scan data uncheck this option Spectral Scan Probes Tab Select and activate the probes under the DUT You can activate the probes by either a left click on individu...

Page 40: ... types will inherit the overlay imported in this step To change overlay for a particular scan select the scan and click or right click on the scan and select Settings To import an overlay file click Overlay Editor select design file or JPG and click open Once the file is imported a window as shown below will open You need to position the image to match the actual DUT position on the EMSCAN s paten...

Page 41: ...kHz bandwidth with a 1 GHz span so that the scan can finish in a reasonable time Interleaved Scan This is the automated version of the Blind Spot Reduction Node This scan is meant to overcome the limitations of the probe polarizations By measuring a DUT twice with a small physical shift between the two scans this blind spot can be eliminated please refer to page 70 Peak Marker List This is the lis...

Page 42: ...ou can activate the probes by either a left click on individual cells or by left clicking and dragging the mouse and choosing Select Cells or clicking on Select All to activate all of the probes Green indicates the activated probes You can deactivate the probes either left click on already selected cells or by left clicking and dragging the mouse and choosing Unselect Cells or by clicking on Selec...

Page 43: ...ll be corrected for the value of the gain or attenuation Internal Analyzer Pre Amp This feature provides extra sensitivity It is ON by default Turn this feature OFF if your spectrum analyzer is not equipped with a Pre Amp Analyzer Tracking Generation This feature will remotely turn on the tracking generator of the FieldFox N9912A spectrum analyzer When you run Spectral or Spectral Spatial Scan the...

Page 44: ...de please refer to page 36 Node settings window automatically opens Click on the box next to Project to be able to subsequently select any of the node data to export by clicking on each node and scan ID Or simply click on the one scan you wish by first checking the box on the node and then selecting the the Scan ID you wish to see in the report You can select any particular scan and any particular...

Page 45: ...probes It is compatible with any sensor that the user wishes to use and that can be connected to a supported spectrum analyzer You can carefully synchronize the positioning of the probe with the manual triggering and create high resolution spatial plots of the DUT There are four methods to further analyze the scanned data Spectral Overlay is a qualitative comparison of two frequency spectra It sup...

Page 46: ...no longer relevant and will be removed at the next software release 4 Measure Peaks It activates the Peak marking feature whereby peaks are rescanned at a tighter bandwidth in order to accurately measure the frequency as long as the peak s value is 5 dB above the average noise floor of the scan By default the maximum number of peaks is set to 10 The maximum number peaks that can be measured is 30 ...

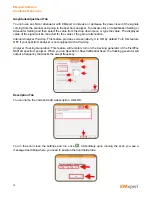
Page 47: ...ting the scan area you reduce the scan time In the case of Spectral Scans ensure to at least have 20 to 30 of the probes selected Overlay Editor Please refer to page 40 Amplitude Adjustment Tab You can use an LNA or attenuator with EMxpert to increase or decrease the power level of the signals coming from the scanner and going to the spectrum analyzer To activate click on Amplification Setting or ...

Page 48: ...ew more seconds for marking peaks EMxpert rescans at a smaller span around the entire major peaks to more accurately identify the peaks and mark them with a blue circle This is done to overcome the 1 to 2 of span spectrum analyzer error and to verify the existence of the peaks Once the scan is completed an image of the scan will be displayed You can mouse over the graph to see coordinates frequenc...

Page 49: ...he last scan data You will only see the last scan data and display the spectral graph of this data In order to keep all scan data when running the scan continuously uncheck Replace Data When Running Continuously in the Spectral Scan settings please refer to page 46 You can display spectral graphs of all the scan data Simply click on the scan and the graph will immediately update EMxpert Software S...

Page 50: ...measuring a DUT twice with a one row physical shift between the two scans this blind spot can be eliminated 4 Peak Marker List Peak Marker List This is the list of frequencies that were detected as being possible peaks in the parent spectral scan If the frequency was peak marked it will show up in the list with an X after it If it was a possible peak that was not peak marked it will not have the X...

Page 51: ... to page 40 Amplitude Adjustment Tab You can use an LNA or attenuator with EMxpert to increase or decrease the power level of the signals coming from the scanner and going to the spectrum analyzer To activate click on Amplification Setting or Attenuator Setting and then select the value from the drop down menu or type the value The displayed value of the signal will be corrected for the value of t...

Page 52: ...o more clearly identify current loops and peak locations If you choose Scan Continuously the screen will refresh 4 to 10 times per second on the EHX depending on the spectrum analyzer s performance If you wish you could move the PCB on the scanner and see the result of the movement in real time the overlay does not move as you have fixed it to a position You can click the red stop sign in the icon...

Page 53: ...a and keeps the last scan data You will only see the last scan data and display the spectral graph of this data In order to keep all scan data uncheck Replace Data When Running Continuously in the Spatial Scan settings You can display spatial graphs of all the scan data Simply click on the scan and the graph will immediately update EMxpert Software Spatial Scan ...

Page 54: ...tically opens Spectral Spatial Scan inherits the setting parameters that were selected in the settings of the Project node please refer to page 39 You can override any of the inherited setting parameters by modifying the tabs in the Spectral Spatial Scan settings window The tabs in the Spectral Spatial Scan Settings window are covered in the following pages Spectral Scan Tab 1 Enter Start Frequenc...

Page 55: ...s or by left clicking and dragging the mouse and choosing Unselect Cells or by clicking on Select None to deactivate all of the probes When you mouse over the grid row and column coordinates are displayed Using the wheel of the mouse will adjust the transparency of the JPG file to help set the probes It is important to activate all the probes under the DUT to have a complete view of the emissions ...

Page 56: ...enerator of the FieldFox N9912A spectrum analyzer When you run Spectral or Spectral Spatial Scan the tracking generator will output a frequency that tracks the swept frequency Description Tab You can name the node and add a description Click OK EMxpert Software Spectral Spatial Scan ...

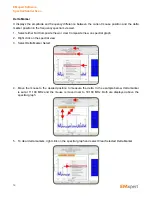
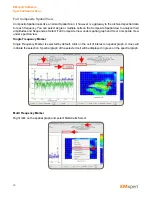
Page 57: ...ngle or multiple frequencies on the Composite Spectral view to analyze the location of them on the board Select Full Composite View under spectral graph and User Composite View under spatial view Single Frequency Marker Single Frequency Marker is selected by default Click on the frequency of interest on spectral graph A red cross will indicate the selection Spatial graph will update to display the...

Page 58: ...play the emissions on the board at the selected frequencies Selected frequencies will be displayed under Freq List Frequency List next to the spatial graph The amplitude and frequency displayed for each cell will be the maximum amplitude for that cell across the selected frequencies To clear frequency markers right click on the spectral graph and select Clear Selected Frequency Marker EMxpert Soft...

Page 59: ...w on spectral graph 2 Right click on the spectral view 3 Select Delta Marker Select 4 Move the mouse to the desired position to measure the delta In the example below delta marker is set at 11 100 MHz and the mouse is moved over to 33 100 MHz Both are displayed above the spectral graph 5 To clear delta markers right click on the spectral graph and select Clear Selected Delta Marker EMxpert Softwar...

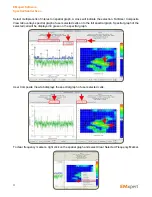
Page 60: ...uencies Select Full Composite View under spatial graph and User Composite View under spectral view Single Frequency Marker Single Frequency Marker is selected by default Click on the cell of interest on spatial graph A cross will indicate the selection Spectral graph of the selected cell will be displayed in green on the spectral graph Multi Frequency Marker Right click on the spatial graph and se...

Page 61: ...er selected cells on to the full spectral graph Spectral graph of the selected cell will be displayed in green on the spectral graph User Composite View tab displays the spectral graph of user selected cells To clear frequency markers right click on the spatial graph and select Clear Selected Frequency Marker EMxpert Software Spectral Spatial Scan ...

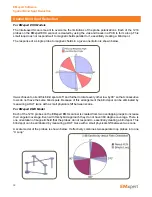
Page 62: ...e reduced to the lowest level allowed by the spectrum analyzer Decreasing the bandwidth will improve the amplitude accuracy and increase the sensitivity the scan will however take more time to complete The bandwidth you choose should not be disproportionate to the span The suggested ratio of Span RBW should be 10 000 e g 10 kHz bandwidth with a 100 MHz span 100 kHz bandwidth with a 1 GHz span so t...

Page 63: ...een indicates the activated probes You can deactivate the probes either left click on already selected cells or left click and drag the mouse and choose Unselect Cells or click Select None to deactivate all of the probes Using the wheel of the mouse will adjust the transparency of the JPG file to help set the probes Overlay Editor Please refer to page 40 EMxpert Software Handheld Probe Scan Note I...

Page 64: ...ature provides extra sensitivity It is ON by default Turn this feature OFF if your spectrum analyzer is not equipped with a Pre Amp Analyzer Tracking Generation This feature will remotely turn on the tracking generator of the FieldFox N9912A spectrum analyzer When you run Spectral or Spectral Spatial Scan the tracking generator will output a frequency that tracks the swept frequency Description Ta...

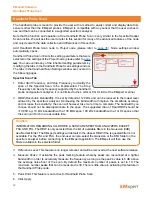
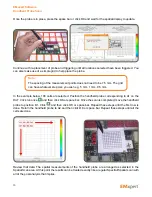
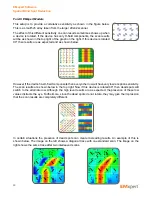
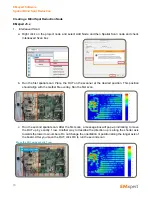
Page 65: ...ve the handheld probe to position B1 Click and then click OK or space bar Repeat these steps until the first row is done Return the handheld probe to A2 and then click OK or space bar Repeat these steps until all the cells are done Review that data The spatial measurements of the handheld probe are arranged as selected in the Spatial Scan area At this point the results can be treated exactly like ...

Page 66: ...ng frequency range eventhough they may have different frequency ranges e g Spectral 1 10 MHz 80 MHz and Spectral 2 30 MHz 120 MHz Add Spectral Overlay node to Project node please refer to page 36 Node settings window automatically opens After you click OK Spectral Overlay window opens Go to the Spectral View Select the data from the datalist that you want to overlay and click drag drop it on to Te...

Page 67: ...device This is especially important for conformance testing where a prototype has received EMC approval and you want to compare production units to it You would link the prototype spectrum to the reference node and compare the spectra from various production units against it by linking them to the test node Add Spectral Comparison node to Project node please refer to page 36 Node settings window a...

Page 68: ...utive rows do not have the same blind spots Because of this arrangement the blind spot can be eliminated by measuring a DUT twice with a small physical shift between scans For EMxpert EMX Model Each of the 1218 probes on the EMxpert EMX scanner is created from two overlapping loops to increase their angular coverage Even with this hybrid approach they do not have 360 degree coverage There is one o...

Page 69: ...en every other row will have very low reception sensitivity The scan results are shown below in the top right Now if this device is rotated 90 then dead spots will switch to the alternate row Although the high level results are as expected the presence of these low values distracts the eye Furthermore since the dead spots do not rotate they may give the impression that the scan results are complet...

Page 70: ...d align with the Gerber file overlay Run the first scan c Run the second spatial scan After the first scan a message box will pop up indicating to move the DUT up by exactly 1 row Another way to describe the direction up is along the shorter axis towards the lower row numbers Do not change the orientation or position along the longer axis of the board After you move the DUT click OK to run the sec...

Page 71: ...71 EMxpert Software Spatial Blind Spot Reduction ...

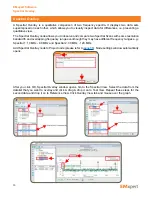
Page 72: ...frequency that is significantly different between the two PCBs This is useful for repairing faulty boards or pinpointing manufacturing process problems Two Spatial Scans that will compared must have overlapping cells Add Spatial Comparison node to Project node please refer to page 36 Node settings window automatically opens After you click OK Compare Spatial window opens Select the data from the d...

Page 73: ... that have emissions emanating from the DUT 5 Compare the powered and unpowered scans taken with the DUT in the identical positions and with identical scanning parameters To determine the significant emission areas on the DUT at the frequencies of interest 6 Run Spatial Scans at the same frequencies used in Steps 1 through 5 If the peaks have not been measured accurately 7 Run narrow Spectral Scan...

Page 74: ...for your DUT and use the Description portion of the setup to quickly and easily identify the purpose of the scan d Use the note facility for descriptions and possible explanations for emissions on the DUT This could come in very handy later when writing a follow up report e If you already have visited a compliance facility and have a report it is a good idea to include this data in the notes and c...

Page 75: ...scanner 10 I added a low noise amplifier or an attenuator between the scanner and the spectrum analyzer and forgot to enter the value in the Amplitude Adjustment menu Can I correct this without rescanning 11 How can I find the frequency of an intermittent or random signal 12 Why does the peak marking process take longer than the estimated time 13 I am doing Before and After testing What feature sh...

Page 76: ... and probe factor responses from cell to cell across all frequencies from scanner to scanner 4 How do I achieve higher frequency accuracy Frequency accuracy is compromised by the spectrum analyzer frequency measurement accuracy of 1 to 2 of span unless the spectrum analyzer is equipped with a higher accuracy frequency counter Therefore by decreasing the span the user can increase the frequency acc...

Page 77: ... Dependant on spectrum analyzer performance 30 dB LNA EHX sensitivity 130 dBm to 35 dBm Dependant on spectrum analyzer performance 40 dB LNA 38 dB Power amplifier Please refer to Technical Bulletin 15 for the test setup 10 I added a low noise amplifier or an attenuator between the EHX scanner and the spectrum analyzer and forgot to enter the value in the Amplitude Adjustment menu Can I correct thi...

Page 78: ...Industry Canada 10 m 3 m and 1 m test distances This is an optional feature Part 3000 0304 that can be purchased separately Please contact EMSCAN 15 I want to do a Pass or Fail test What feature should I use Use either Spectral Overlay or Spectral Comparison feature You can also use the Threshold Red Green display with Auto scale off and set to the reference PCB emissions to see if a PCB under tes...

Page 79: ...ee what is going on inside a multi layer board A chamber for example will only deal with far field and will not differentiate between what is coming from the edge the most external layer the internal layers and the interaction between the layers It is the most blind of all EMI test solutions to help design a better PCB with EMI reduction at the source Automated single probe handheld probe and EMxp...

Page 80: ...trument type Please calibrate spectrum analyzer Driver cannot query the connected spectrum analyzer type 1 Calibrate spectrum analyzer see Spectrum Analyzer Setup 2 Try one more time 3 If you get the same error message again uninstall and reinstall EMxpert software Failed to read scanner type Driver cannot read scanner type on the adaptor 1 Check the connection between the scanner and the adaptor ...

Page 81: ...ies of the spectrum analyzer detailed range information The spectrum analyzer is not capable of running with the requested frequencies The detailed range information details what has been requested and the frequency capabilities of the attached spectrum analyzer Change the frequency limits in the settings to supported values and rerun the scan The start frequency is lower than the licensed low fre...

Page 82: ...regulatory and safety compliance use only the provided power and interface cables and install them properly Different types of cord sets may be used for connections to the main supply circuit Use only a main line cord that complies with all applicable device safety requirements of the country of use Installation this device must be in accordance with national wiring codes and confirm to local powe...

Page 83: ...ote This equipment has been tested and found to comply with the limits for a Class B digital device pursuant to Part 15 of the FCC Rules These limits are designed to provide reasonable protection against harmful interference in a residential installation This equipment generates uses and can radiate radio frequency energy and if not installed and used in accordance with the instructions may cause ...

Page 84: ...Mxpert conforms to the following standards and other related normative documents Electromagnetic emissions Council Directive 2004 108 EC EN61326 1 Ed 2 0 2012 07 CISPR 11 2009 A1 2010 FCC Part 15 B Electromagnetic immunity Council Directive 2004 108 EC EN61326 1 Ed 2 0 2012 07 IEC61000 4 2 2008 IEC61000 4 3 2006 A1 2007 A2 2010 IEC61000 4 4 2004 A1 2010 EN61000 4 5 2005 EN61000 4 6 2008 IEC61000 4...

Page 85: ...85 Notes EMxpert Software Notes ...

Page 86: ... 1 1715 27 Avenue NE Calgary AB T2E 7E1 Canada Tel 1 403 291 0313 Fax 1 403 250 8786 www emscan com EM UM EHX v 5 0 6 1 10 15 ...

Reviews: