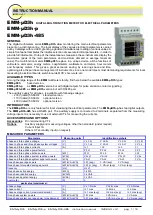


EMM-µD3h EMM-µD3h-p EMM-µD3h-485 instruction manual
IM380-U v3.1
pag. 9 / 12
MEASURES VISUALISATION
According with the glowing status of the
G
LED the reading of the measures is visualised on display
C
,
either the three
measures of the phase values or the three phase measured values
(average of the individual phases for voltage,
current, power factor and the sum of the individual phases for powers).
With the
G
LED off, the instrument will visualise the
three measures of phase
(L1, L2 and L3 respectively) of the
parameter indicated by the light of the LED
D
. for the phase to phase measures (V
L-L
), the three measures are
understood V
L1-L2
, V
L2-L3
, V
L3-L1 respectively
.
By pressing the
B
key, you may select the parameters to visualise, which will be indicated by the LED
D
.
The visualisation of the frequency page shows also the status of the digital output (if present).
By pressing the
A
key with the
G
LED on, the instrument will visualise the selected parameters in
three phase values
(average of the individual phases for voltage, current, power factor and the sum of the individual phases for powers).
In this mode, each page will show the measures of 3 parameters, indicated by the LED
D
, excluding the frequency pages,
the energy meters and the hour meters.
The visualising of the energy meters is only possible with the
G
LED on.
If the hour meter is available, is visualised: as hour meter per phase, activated by the three phase current, after the
visualisation of energies in those types fitted with energy meters.
By pressing the same key again, the instrument returns to the visualisation of the phase parameters.
Should the single phase system wiring been made, the visualisation of the values will be shown in the same way as per
the three phase measures, indicating three parameters on each page. In the present case the LED
G
will never glow,
since it isn’t a three phase system.
VISUALISATION OF ENERGY AND HOUR METERS
The visualisation of the energy meters are shown with the lighting of the LED
kW + …h
indicating the active energy values
(kWh), whilst the lighting of the LED
kVAr + …h
are indicating the reactive energy values (kVArh).
The lighting of the
LED h
alone, identifies the reading of the hour meter.
The reading of the meters uses the 9 digits (maximum reading 99999999.9) of the display
C
: the measure comes
visualised in such a way that, the display L1 will show the first 3 digits, the display L2 the second 3 digits and the display
L3 the last 3.
For example if: L1=000, L2=028, L3=53.2, the reading is equal to 00002853.2 kWh.
In the case of the hour meter, it uses only 6 digits (maximum reading 99999,9) of the display
C
: the measure comes
visualised in such a way that, the display L2 will show the first 3 digits, and the display L3 the last 3 digits .
For example if: L2=008, L3=53.2 the reading is equal to 00853.2 h.
NOTE ON THE VISUALISATION OF THE PARAMETERS
The visualisation of a capacitive power factor value comes represented by a
–
sign before the first digit of the display
(example of reading:
indicates a capacitive power factor of
)
The visualisation of a negative active power (inverted connection of the CT’s or cogeneration presence) comes
represented by a
–
sign before the first digit of the display.
VISUALIZATION OF THE PHASE VALUES
(for three-phase connection)
(connection mode set to
or
)
L1
L2
L3
L
out
max
avg
SET
Visualization page 1
VL1-N on L1 = 232 V
VL2-N on L2 = 230 V
VL3-N on L3 = 229 V
L1
L2
L3
L
out
max
avg
SET
Visualization page 2
IL1
L1 = 28,2 A
IL2
on
on L2 = 9,2 A
IL3 on L3 = 35,7 A
L1
L2
L3
L
out
max
avg
SET
Visualization page 3
PL1 on L1 = 562 kW
PL2
on L2 = 184 kW
PL3 on L3 = 99,2 kW
L1
L2
L3
L
out
max
avg
SET
Visualization page 5
QL1
L1 = 562 kVAr
QL2
on
on L2 = 184 kVAr
QL3 on L3 = 99,2 kVAr
L1
L2
L3
L
out
max
avg
SET
Visualization page 6
SL1
L1 = 562 kVA
SL2
on
on L2 = 184 kVA
SL3 on L3 = 99,2 kVA
L1
L2
L3
L
out
max
avg
SET
Visualization page 7
VL1-L2 = 401 V
VL2-L3 = 403 V
VL1-L3 = 399 V
L
out
max
avg
SET
L1
L2
L3
Visualization page 8
F on L1 = 49,9 Hz
Out = ON
Dig. Out = Alarm
L1
L2
L3
L
out
max
avg
SET
Visualization page 4
PF on L1 = 0,93
PF
on L2 = 0,92
PF on L3 = 0,90