4-8
Cisco Customer Response Solutions Servicing and Troubleshooting Guide, Release 5.0(1)
Chapter 4 Trace
Viewing and Interpreting the Trace Files
Viewing and Interpreting the Trace Files
The Cisco CRS server stores the trace files in the Log directory under the directory in which you installed
the Cisco CRS component. From the Cisco CRS Administration menu, you can view a list of all trace
files and display the contents of any trace file.
Displaying a Trace File
To display a CRS component trace file, follow these steps:
Step 1
From the Cisco CRS Administration menu, choose
System > Tracing
.
The Trace Configuration web page appears.
Step 2
Select and expand a component from the navigation bar and select
Trace Configuration
.
A list of subfacility categories appears.
Step 3
Expand the category of subfacility, select the levels of debugging for specific subfacilities, and click
Update
.
The trace file appears in a separate window.
Interpreting a Trace File
The trace files contain information in standard Syslog format. The file includes some or all of the
following information for each event that it records:
•
Line number
•
Date and time the event occurred
•
Facility and subfacility name
•
Severity level
•
Message name
•
Explanation
•
Parameters and values
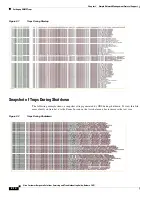
The Thread Dump Trace File
The thread dump trace file is named JVM.log. It is stored on the Cisco CRS server in the Log directory
under the directory in which you installed the Cisco CRS Engine. This file contains stack trace
information about all threads that are running on the Cisco CRS system. You can write information to
this file when you need it. In addition, the system writes information to this file automatically if the
system detects a severe system problem. When new information is generated, it is appended to the
existing thread dump file.
Summary of Contents for Cisco Unified Queue Manager
Page 21: ...P A R T I Serviceability ...
Page 22: ......
Page 61: ...P A R T I I Troubleshooting ...
Page 62: ......

