


Cadi.
Sense
User Manual
T-S1-800.900-I10-C01
12
2.7
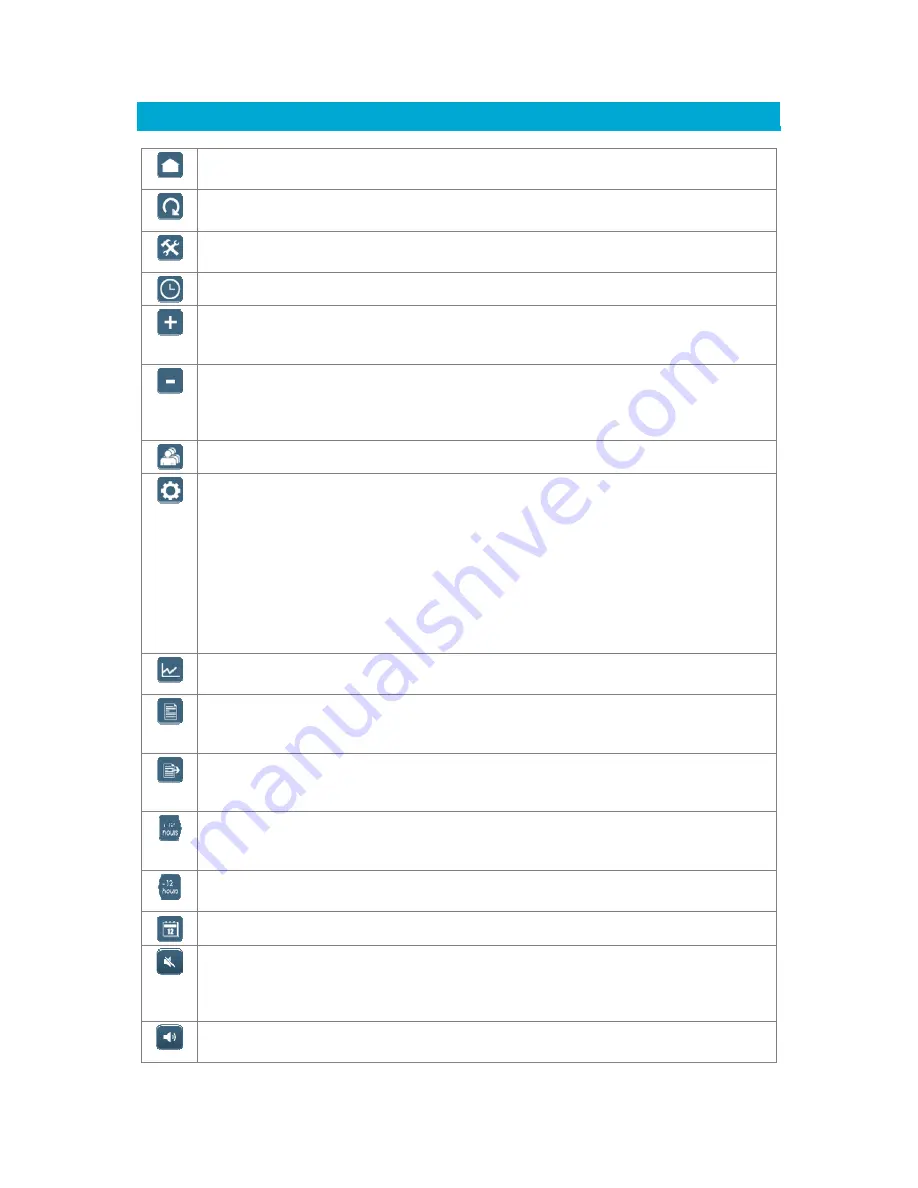
Understanding the Cadi.Sense icons on your SmartNode webpages
Go to home page (temperature monitoring page)
: View a single sensor
temperature in large font size.
Refresh
: Manually refresh the current page to get the latest temperature. The
page will actually refresh automatically every 5 minutes.
Advanced settings
: View a list of all advanced settings, including connecting to
your WiFi router.
Set timezone, date & time
: Manually set the timezone, date, and time if necessary.
Add ThermoSensor
: Add a new sensor. Concurrent monitoring of several persons
at the same time is possible, so long as each person wears a sensor and the
sensors are within the wireless reception range (3 to 5 m) of the SmartNode.
Remove ThermoSensor
: Remove a sensor. All data associated with the sensor will
be deleted. So before deleting, you may want to export the data using the
“Export Temperature History Data” icon that will be available only in laptop’s web
browser.
Go to main page (sensor details page)
: View a list of all registered sensors.
Sensor settings
:
(1)
Type in the name/nickname of the person wearing the sensor (default: empty).
(2)
Set the temperature scale to ºC (degree Celsius, default) or ºF (degree
Fahrenheit).
(3)
Set the “High Temperature Threshold” (default: 37.8 ºC). For some countries, this
threshold is fixed at the default value and cannot be changed.
(4)
Turn on/off the “Message Alert” (default: OFF). If this alert is turned on, a
message will be displayed whenever the temperature exceeds the threshold.
For some countries, this feature is turned off permanently and cannot be
turned on.
Temperature chart
: View the temperature graph. The chart will appear only 15
minutes after the first record is stored.
Temperature history
: View a list of temperature records. The records will appear in
about every 15-minute interval. Readings below 32.1 ºC will be shown as “Lo”, and
readings above 42.0 ºC will be shown as “Hi”.
Export temperature history data
: Export data (temperature and date-time) in
“.csv” format for your further analysis on spreadsheets. This feature is available only
from a laptop’s web browser.
Shift forward 12 hours
: Shift the temperature chart/history forward by 12 hours.
Note that the temperature chart/history will show a 24-hour period, with the
default period being the current day from 00:00 to 23:59.
Shift backward 12 hours
: Shift the temperature chart/history backward by 12
hours.
Jump to date
: Shift the temperature chart/history to a date of your choice.
Audio Alert OFF:
Press this icon to turn on the “Audio Alert” (default: OFF). If this
alert is turned on, a sound will be played whenever the temperature exceeds the
threshold. For some countries, there is no audio alert. This icon appears only on
iPhones.
Audio Alert ON:
Press this icon to turn off the “Audio Alert”. For some countries,
there is no audio alert. This icon appears only on iPhones.
Summary of Contents for Cadi.Sense
Page 1: ...Cadi Sense Wireless Thermometer User Manual v3 21 3 T S1 800 900 I10 C01...
Page 24: ...Cadi Sense User Manual T S1 800 900 I10 C01 24 3 2WIRE 2701HGV E 4 Linksys E2000...
Page 25: ...Cadi Sense User Manual T S1 800 900 I10 C01 25 5 Dlink DIR 655 6 ZyXel...
Page 26: ...Cadi Sense User Manual T S1 800 900 I10 C01 26 7 ASUS RTN16 8 EnGenius ESR9850...
Page 30: ...Cadi Sense User Manual T S1 800 900 I10 C01 30...


