41
9.6.1
Channel Info
•
Information about resolution, frame rate and streaming bit rate are
shown in all the 4 or 8 quadrants
– only in full screen view (area 4).
•
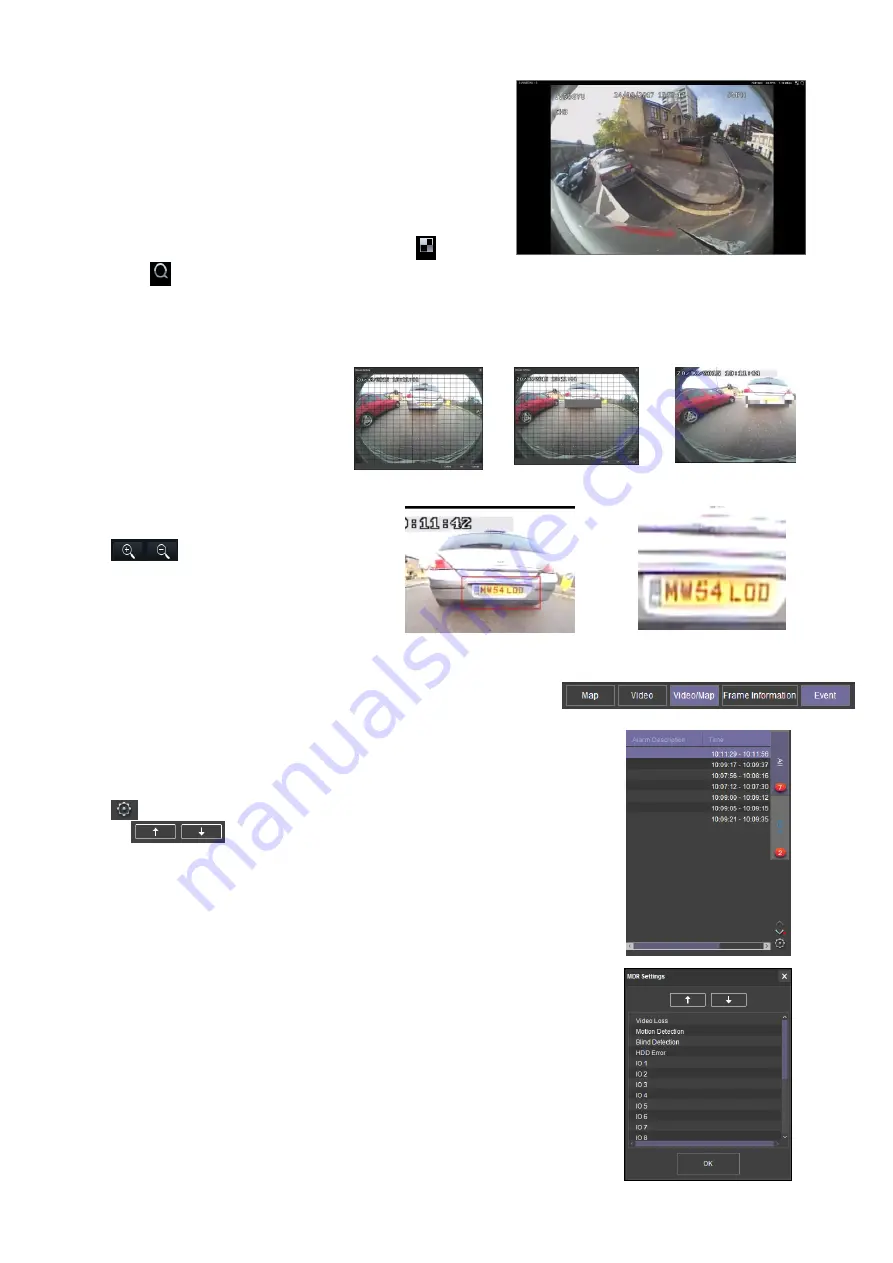
On the top left of each image, users can see the MDR-Dashboard
channel number followed by the company number, vehicle registration
and MDR channel number.
Channel Information Figure 148
shows: “4
3-3 -
4”.
•
Access full screen mode of a single channel by double-clicking the
desired channel. Exit a full screen view by double-clicking again.
•
Audio playback is limited to one channel at a time, single-clicking a
channel will access the audio feed
– a green outer box visually confirms
the current audio feed being accessed.
•
Each camera channel has two additional features,
BLUR
and
ZOOM
.
•
Users can use blur to create a mosaic setting of an area which will be
blurred throughout video playback. See
Creating Mosaic for Blur Figure
Setting the Blur Area Figure 150
•
BLUR
can be applied to a channel for a clipping of a video segment.
Click the delete button to remove a blur from a channel.
Channel Information Figure 148
•
ZOOM
is used to create a magnified
view of a selected area of a camera
channel. Click the magnifying glass and
then choose the desired box area. This
is now the only area that will be visible
during playback. To exit this view,
double-click the camera channel. See
and
Creating Mosaic for Blur
Figure 149
Setting the Blur Area
Figure 150
Blur Activated Figure 151
•
ZOOM
cannot be
applied
to a clipping
– this
feature is for viewing a critical area more
closely.
•
is
used
to
ZOOM
in or out of the
time scale. Maximum
ZOOM
in is 5 seconds
and minimum
ZOOM
out is 24 hours.
Choosing Zoom Area Figure 152
Zoom area Figure 153
9.6.2
Events and Graphs
•
Information about events can be viewed by clicking on the
EVENT
button as
shown in
Extended View Settings Figure 154
. This will provide a list of all the
events.
•
Events can also be filtered by clicking on each tab shown in
. Users may use the arrows to access various tab options. Double-
clicking a log in the event list will jump to that point in playback mode.
•
OSD settings
– the sensor 2-character names are displayed in the event list
with brackets. See
•
Events can also be ordered based on a user-specific hierarchy. Click on the
icon to access and change the order. Use
the
shown in
Extended View Settings Figure 154
Event Information Figure 155
•
See
. Event information consists of event names,
event times and event descriptions (use horizontal scrollbar to view).
•
Users can access vehicle information such as
➢
Recorded channel data graph based on time
➢
Speed graph based on time
➢
G-force data graph based on time
•
Double-clicking on a graphical point will jump to that time in playback.
•
Click the drop-down menu shown in
VEHICLE STATUS
.
•
Once the vehicle status sub-menu has been opened as shown in
, click on the desired option to view the graphical data.
Event Hierarchy Figure 156
Summary of Contents for MDR-504-500
Page 9: ...9 3 5 MDR 504xx 500 Connection Diagram MDR 504xx 500 Connection Diagram Figure 8...
Page 10: ...10 3 6 MDR 508xx 1000 Connection Diagram MDR 508xx 1000 Connection Diagram Figure 9...
Page 89: ...89...
Page 90: ...90...
Page 91: ...91...
Page 92: ...92 18 10 2017 10 52 00 MDR 500 Series Installation Operation Guide v2 0 ENG 5145A docx...


