


Figure 34. Home Screen Without Annotations
7.1.3 Inspection Statistics
Click Display Mode
to access the Inspection Statistics.
The Inspection Statistic mode has three screens:
• History
• Inspection Result
• Inspection Inputs
Click the arrows to access the other screens.
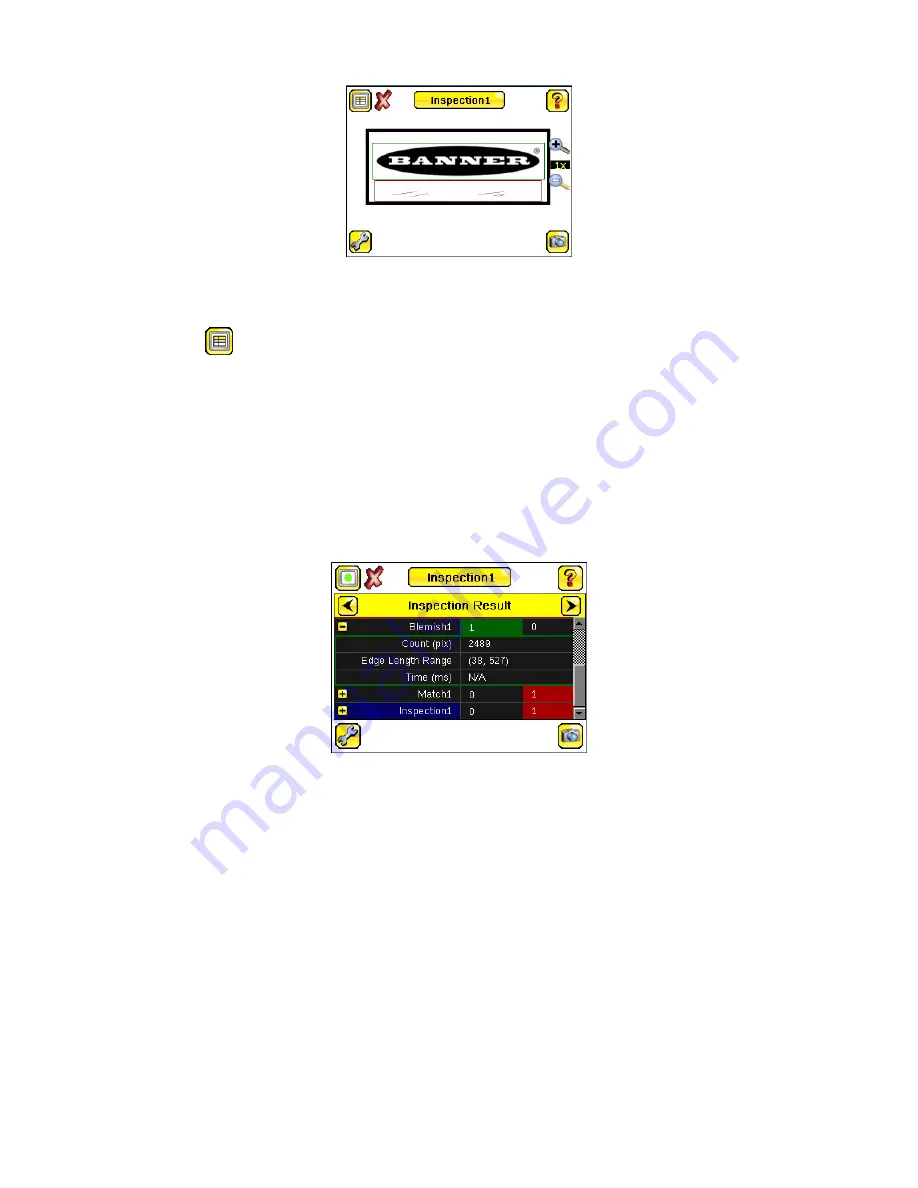
Inspection Results
The Inspection Result screen shows data about the current inspection being viewed.
The table contains the results of each sensor in the inspection. To view details of each sensor, click +. If a sensor fails, the
box is red. An icon beside the sensor name indicates the reason it failed.
Figure 35. Inspection Result
History
The History screen shows inspection history from the last iVu reboot, or from the last time the statistics were reset. The
history includes:
• Total Frames—Total number of inspections executed
• Passed—Running total of parts that passed inspection
• Failed—Running total of parts that failed inspection
• Missed triggers—Running total of missed triggers
• Time Range—Minimum and maximum inspection times observed
Click Reset to reset the statistics.
The table contains history of each sensor in the inspection. Expand or collapse data of each sensor as required using + and
–. The green area indicates that the sensor passed. Red indicates that the sensor failed. If a sensor fails, an icon beside the
sensor name indicates the reason for the failure.
iVu Plus TG and Color Gen2 Image Sensors
32
www.bannerengineering.com - Tel: + 1 888 373 6767


