EF600 Instruction Manual
Asymptote Ltd.
St John’s Innovation Centre, Cowley Road, Cambridge, CB4 0WS, UK
Tel: +44 1223 421161, Fax: +44 1223 421166, E-mail: [email protected]
10
4.
User Interface (EF600-01, EF600-10)
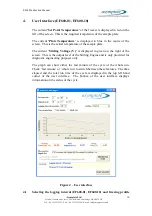
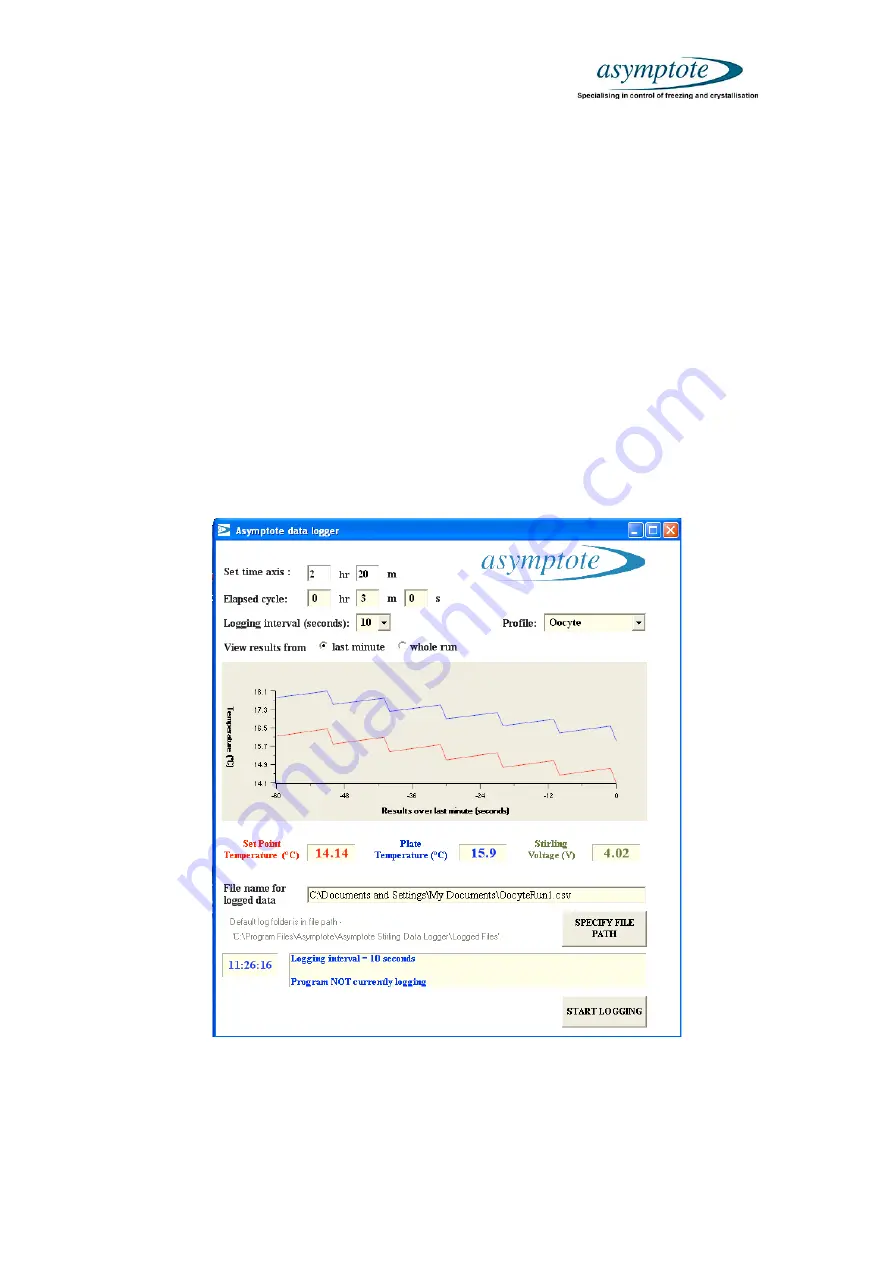
The current
‘Set Point Temperature’
of the freezer is displayed in red on the
left of the screen. This is the required temperature of the sample plate.
The current
‘Plate Temperature’
is displayed in blue in the centre of the
screen. This is the actual temperature of the sample plate.
The current
‘Stirling Voltage (V)’
is displayed in green on the right of the
screen. This is the output level of the Stirling Engine and is only provided for
diagnostic engineering purposes only.
The graph can show either the last minute of the cycle or the whole run.
Check ‘last minute’ or ‘whole run’ to switch between these features. The time
elapsed and the total run time of the cycle is displayed in the top left hand
corner of the user interface. The bottom of the user interface displays
information on the status of the cycle.
Figure 4 – User interface
4.1
Selecting the logging interval (EF600-01, EF600-10) and freezing profile

