42
Chapter 4 - Configuration Management
ASUS GigaX 1024i+
When you enable the Cable Diagnosis on a port, the connection of
this port will be disconnected during the diagnosis.
4.8 Statistics Chart
The
Statistics Chart
pages provide network flow in different charts. You
can specify the period/time to refresh the chart. You can monitor the
network traffic amount in different graphic chart by these pages. Most MIB-
II counters are displayed in these charts.
Click <
Auto Refresh
> to set the period for retrieving new data from the
switch. You can differentiate the statistics or ports by selecting
Color
.
Finally, click <
Draw
> to let the browser to draw the graphic chart. Each
new Draw will reset the statistics.
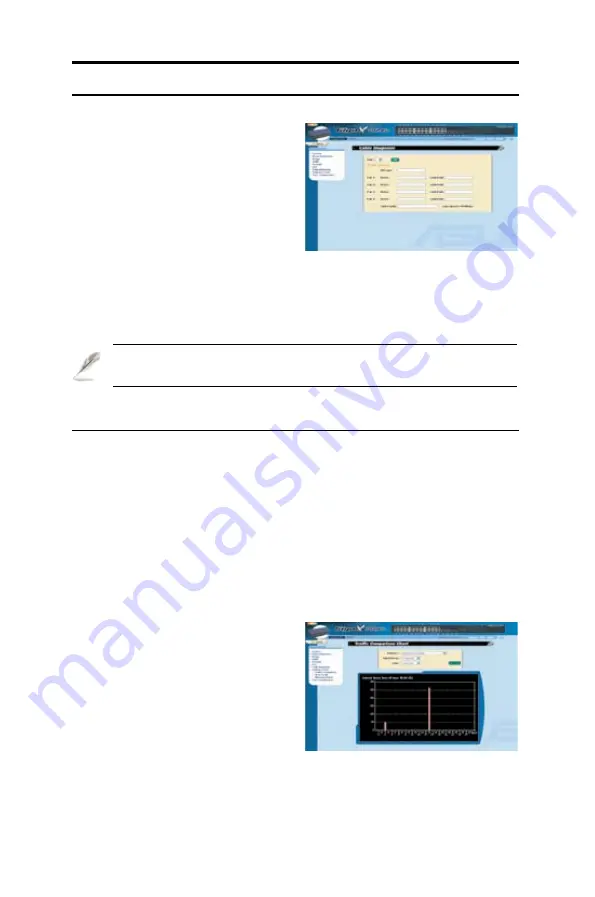
4.7 Cable Diagnosis
The major function of
Cable
Diagnosis
is to detect cable fault
(open or short) and report the
estimated fault location. Moreover,
Cable Diagnosis can also detect
PHY type (10M, 100M or 1000M)
as well as estimated cable length
of a normal cable. Cable length
estimation only supports Giga speed
mode.
Just select a port number and click <
Go
>. Test results shall be displayed
accordingly.
Figure 45. Cable Diagnosis
Figure 46. Traffic Comparison
4.8.1 Traffic Comparison
This page shows one statistical item
for all the ports in one graphic chart.
Specify the statistics item to display
and click <
Draw
>. The browser will
show you the updated data and
refresh the graphic periodically.


