V4.3 10/09/19
UD0090
Page 68 of 143
This Document is uncontrolled when printed unless over stamped “CONTROLLED DOCUMENT"
5.
When you have selected the appropriate settings you can click Save to apply any changes made and be taken
back to the Administration menu or click Stats to view more detailed information on the connection to Traka
Web.
6.
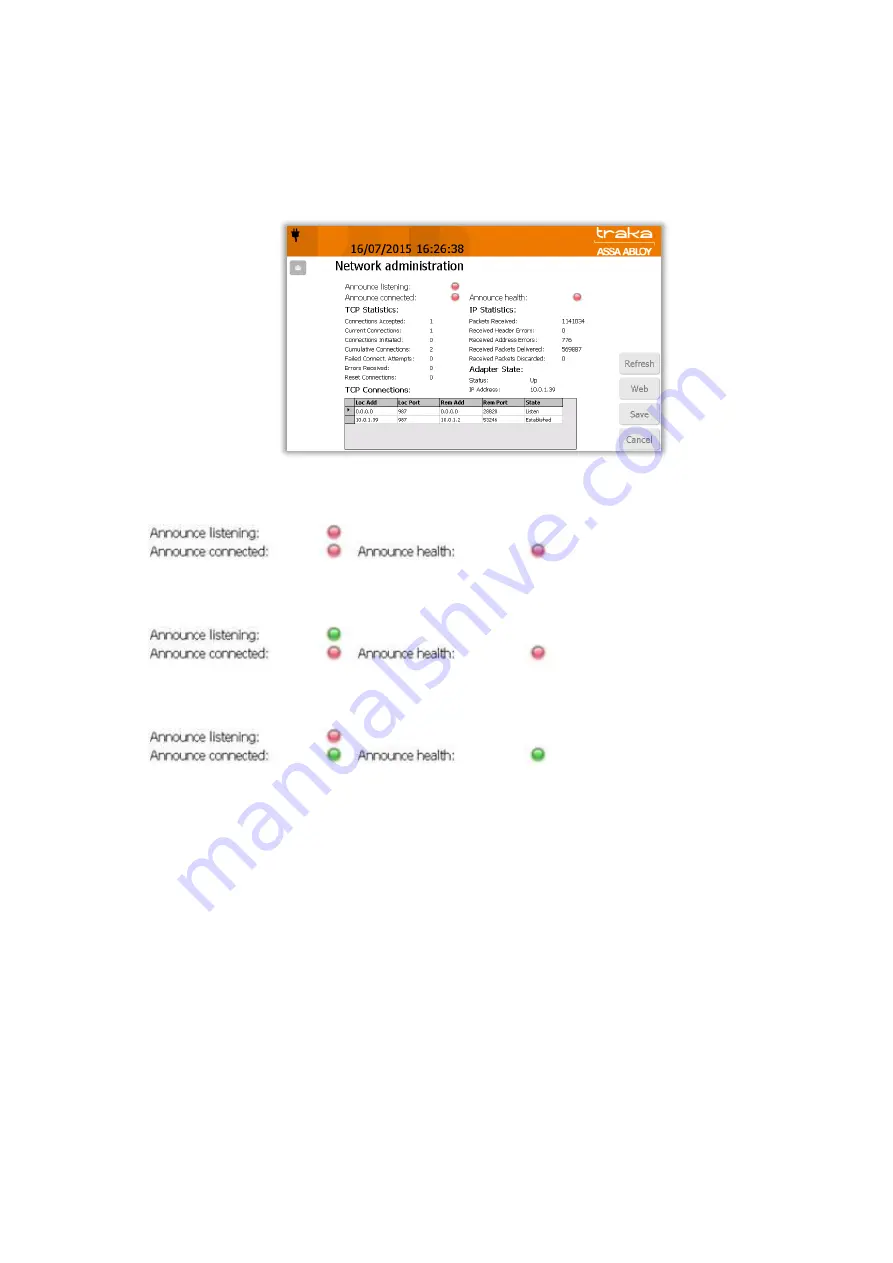
The Stats screen displays various pieces of information regarding the connection health between Traka Touch
and Traka Web. At the very top of the page there are on screen LED’s that indicate the stage of communication
with Traka Web.
When all the lights are red this means no communication is taking place and the system isn’t attempting to
make a connection.
When the ‘Announce Listening’ light turns green this indicates that the system is attempting to make a
connection.
Once a connection is established the ‘Connected’ and ‘Health’ lights will turn green. The listening light will
remain red as long as a continuous connection is maintained.
7.
Clicking the Web button will take you back to the first network admin screen. Clicking Save will save any
changes you have made and take you back to the administration menu. From there click Exit to be taken back
to the login screen.
You will now notice that in the top right hand corner of the screen next to the Traka logo are thirteen small blocks, one
of which is black. These are status blocks, showing each stage of communication with Traka Web.


